
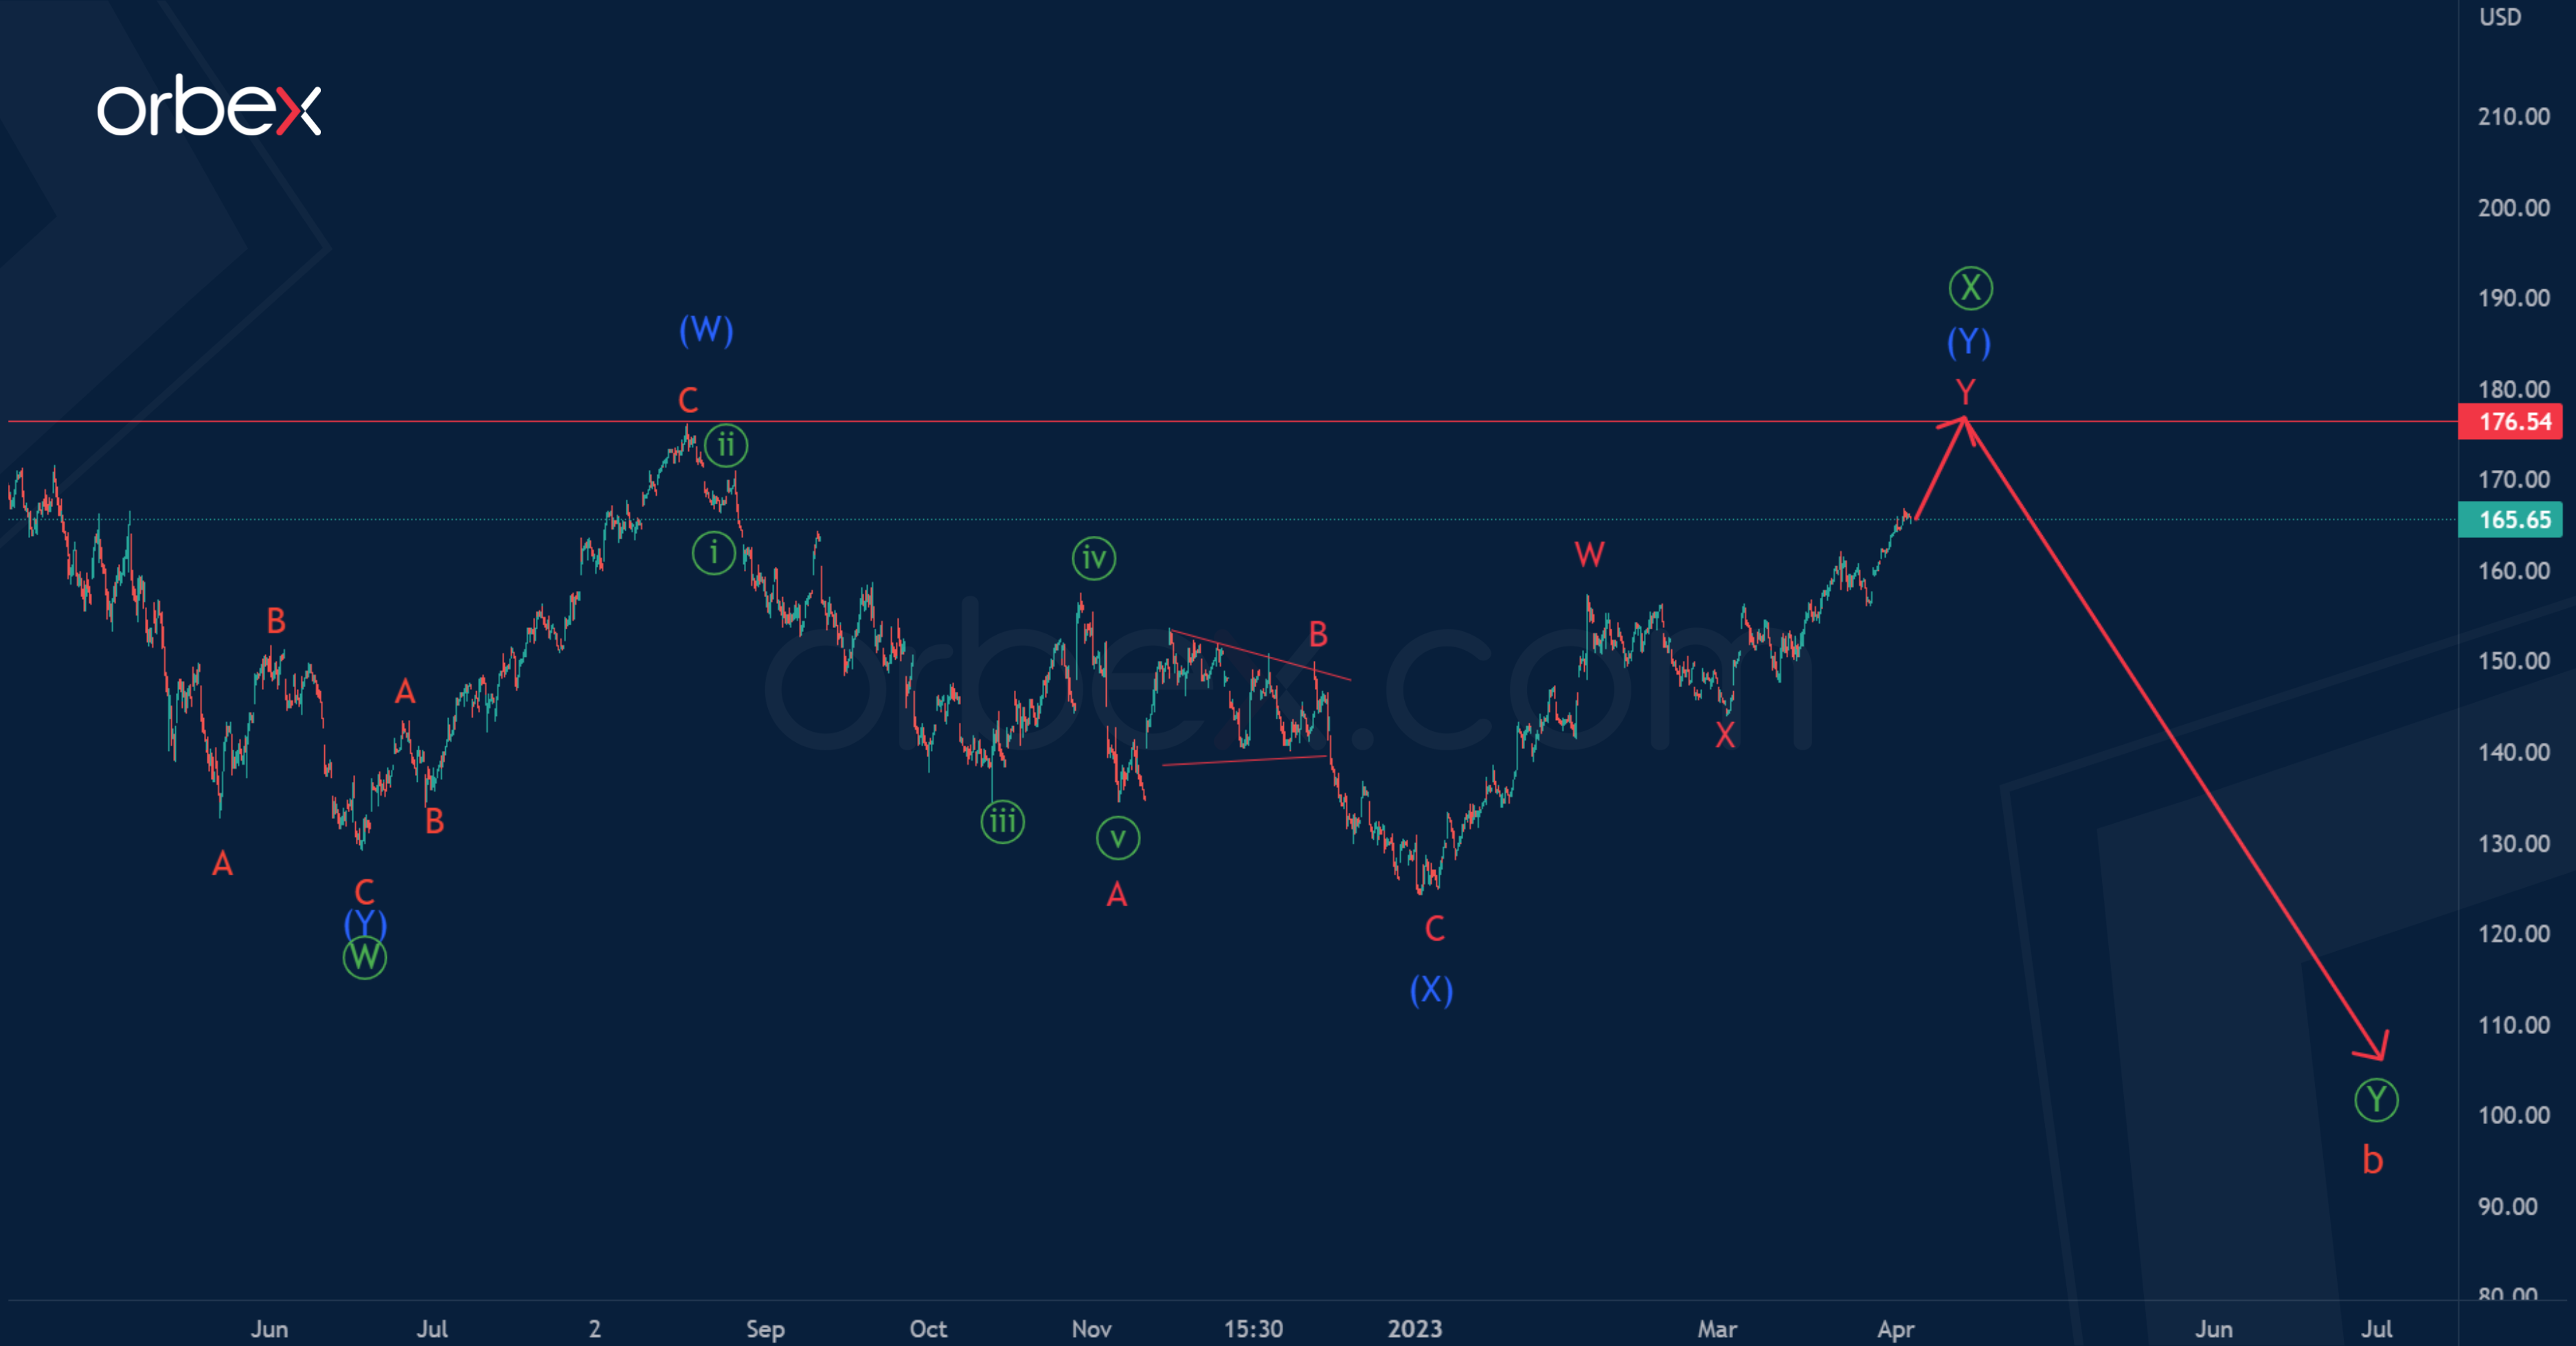
The structure of AAPL shares suggests the formation of a correction pattern taking the form of an a-b-c cycle zigzag.
Correction b is under development. Most likely, it will end as a double zigzag Ⓦ-Ⓧ-Ⓨ of the primary degree. It seems that at the moment the market is forming a horizontal intervening wave Ⓧ. This can end at a maximum of 176.54 in the form of a double three (W)-(X)-(Y).
After the horizontal pattern ends, a price reversal is likely and the beginning of a decline.

Alternatively, the primary intervening wave has been completed for a long time, and the primary wave Ⓨ is in the process of construction.
An intermediate correction (X) could have ended in it, so in the next coming trading days the price could go down in a new wave (Y).
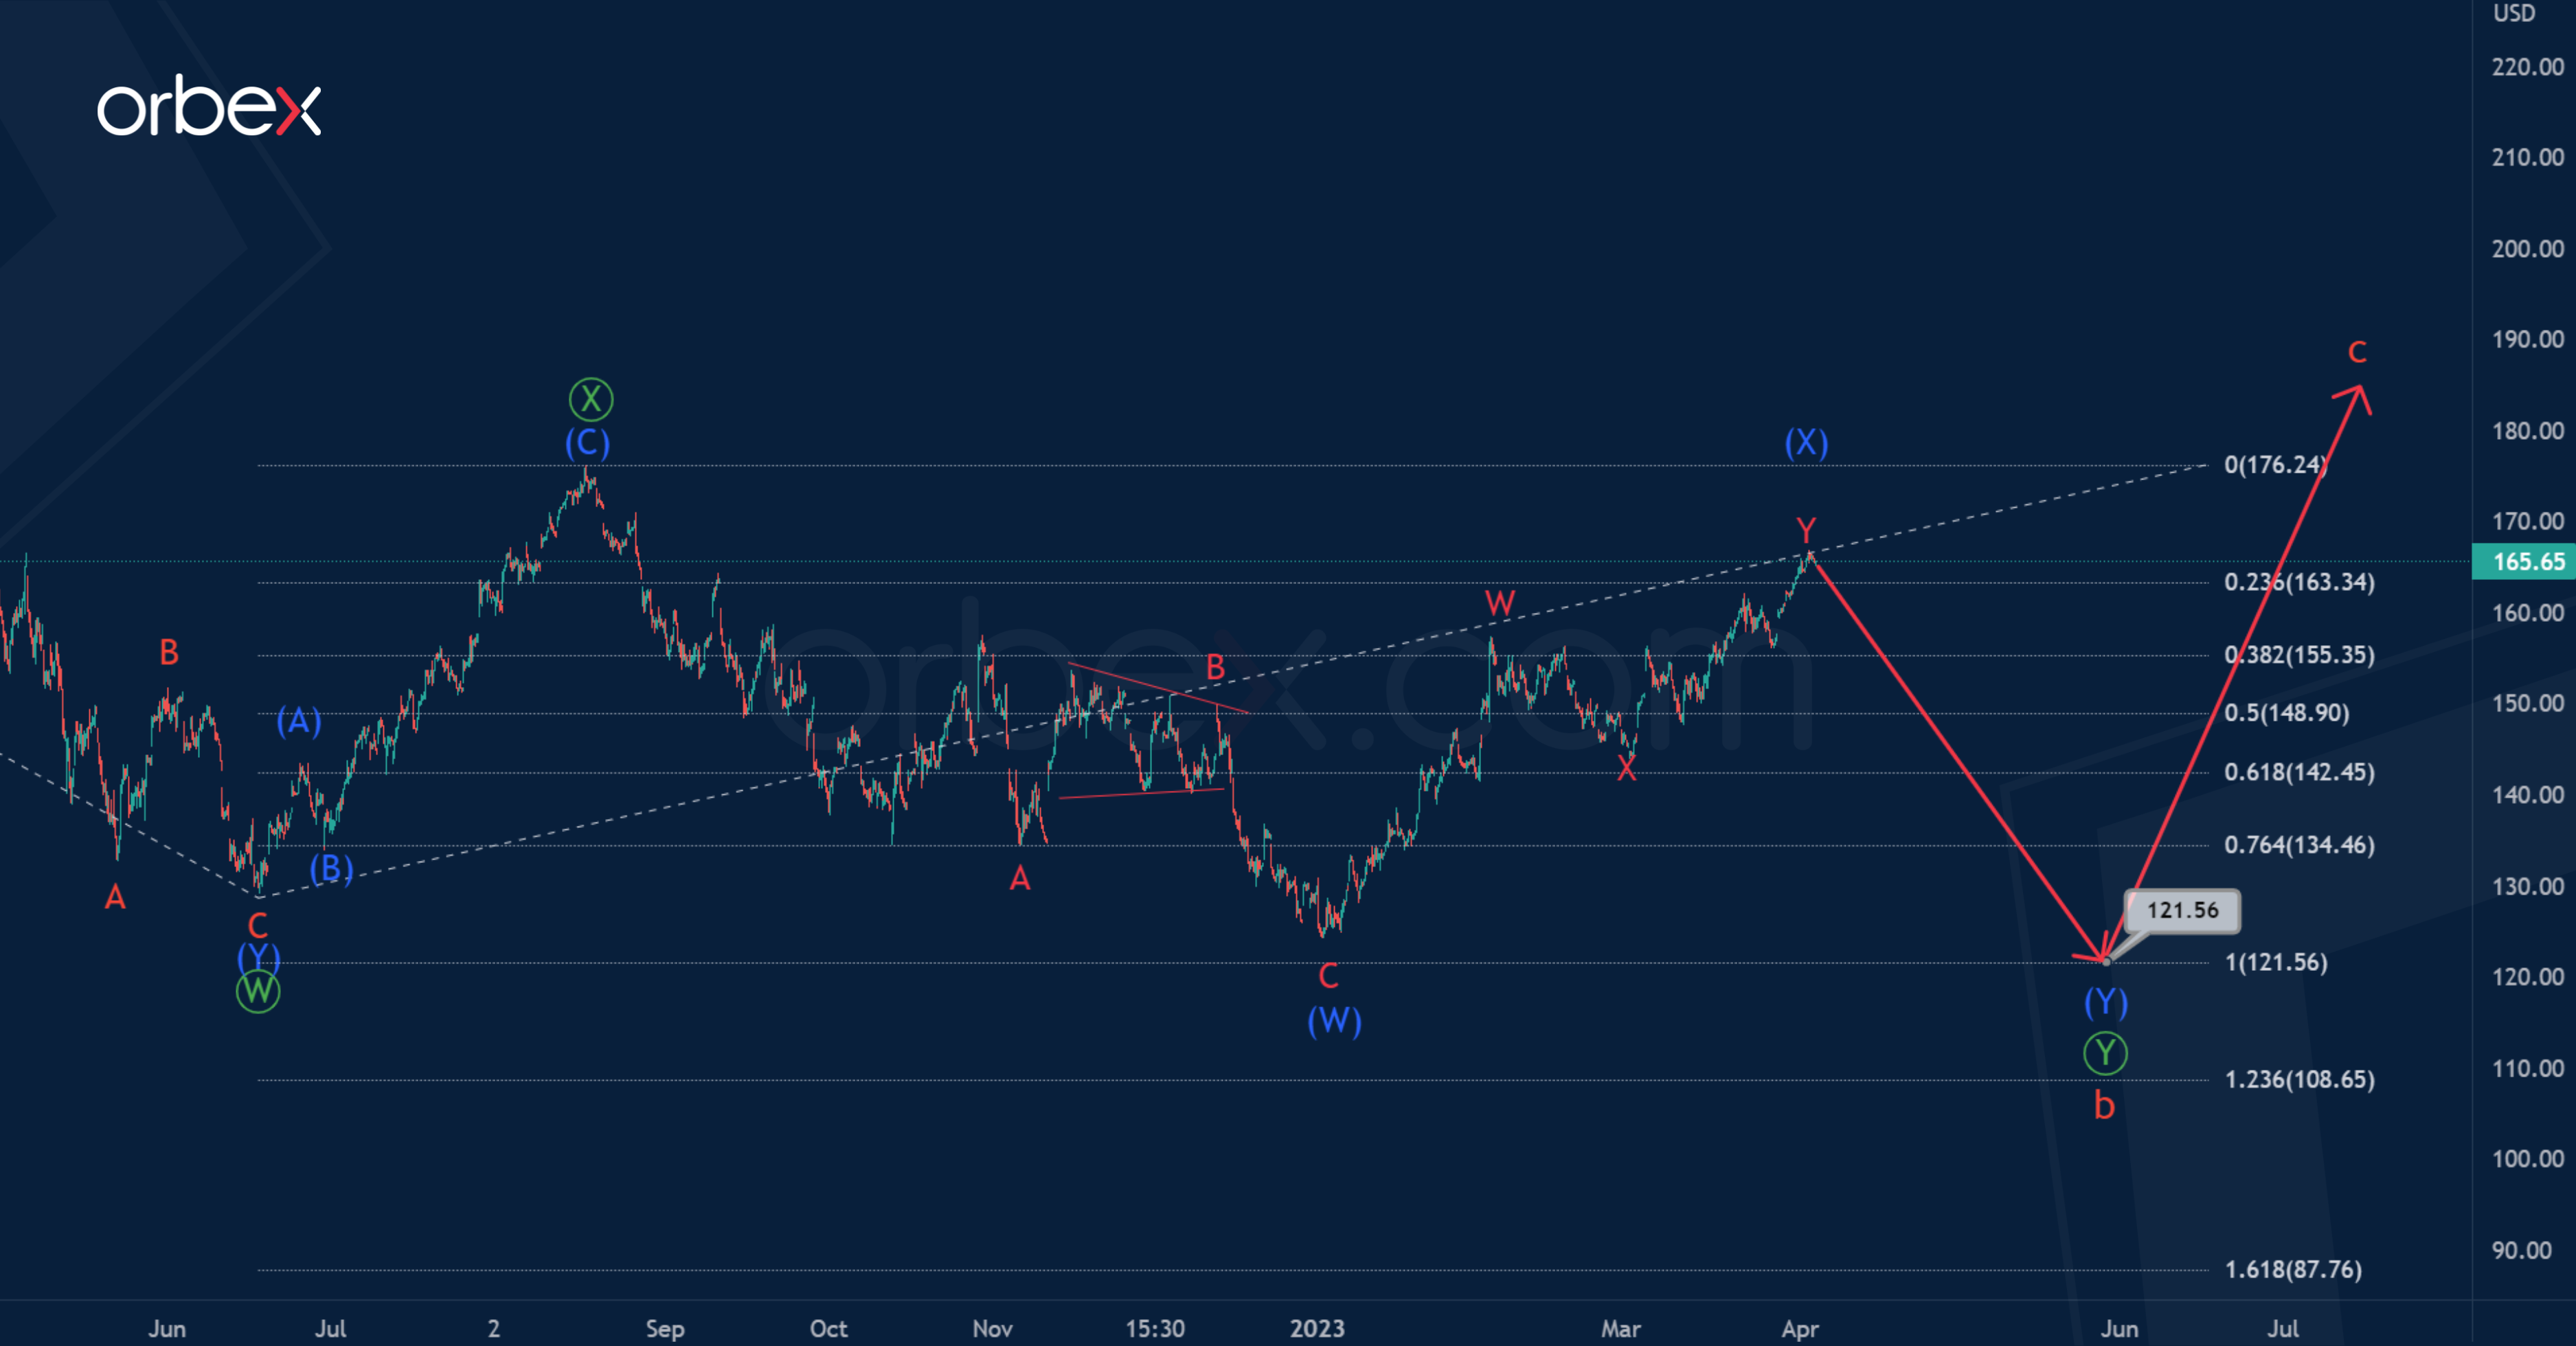
The bearish trend could last to 121.56. At that level, primary waves Ⓦ and Ⓨ will be equal to each other.

