
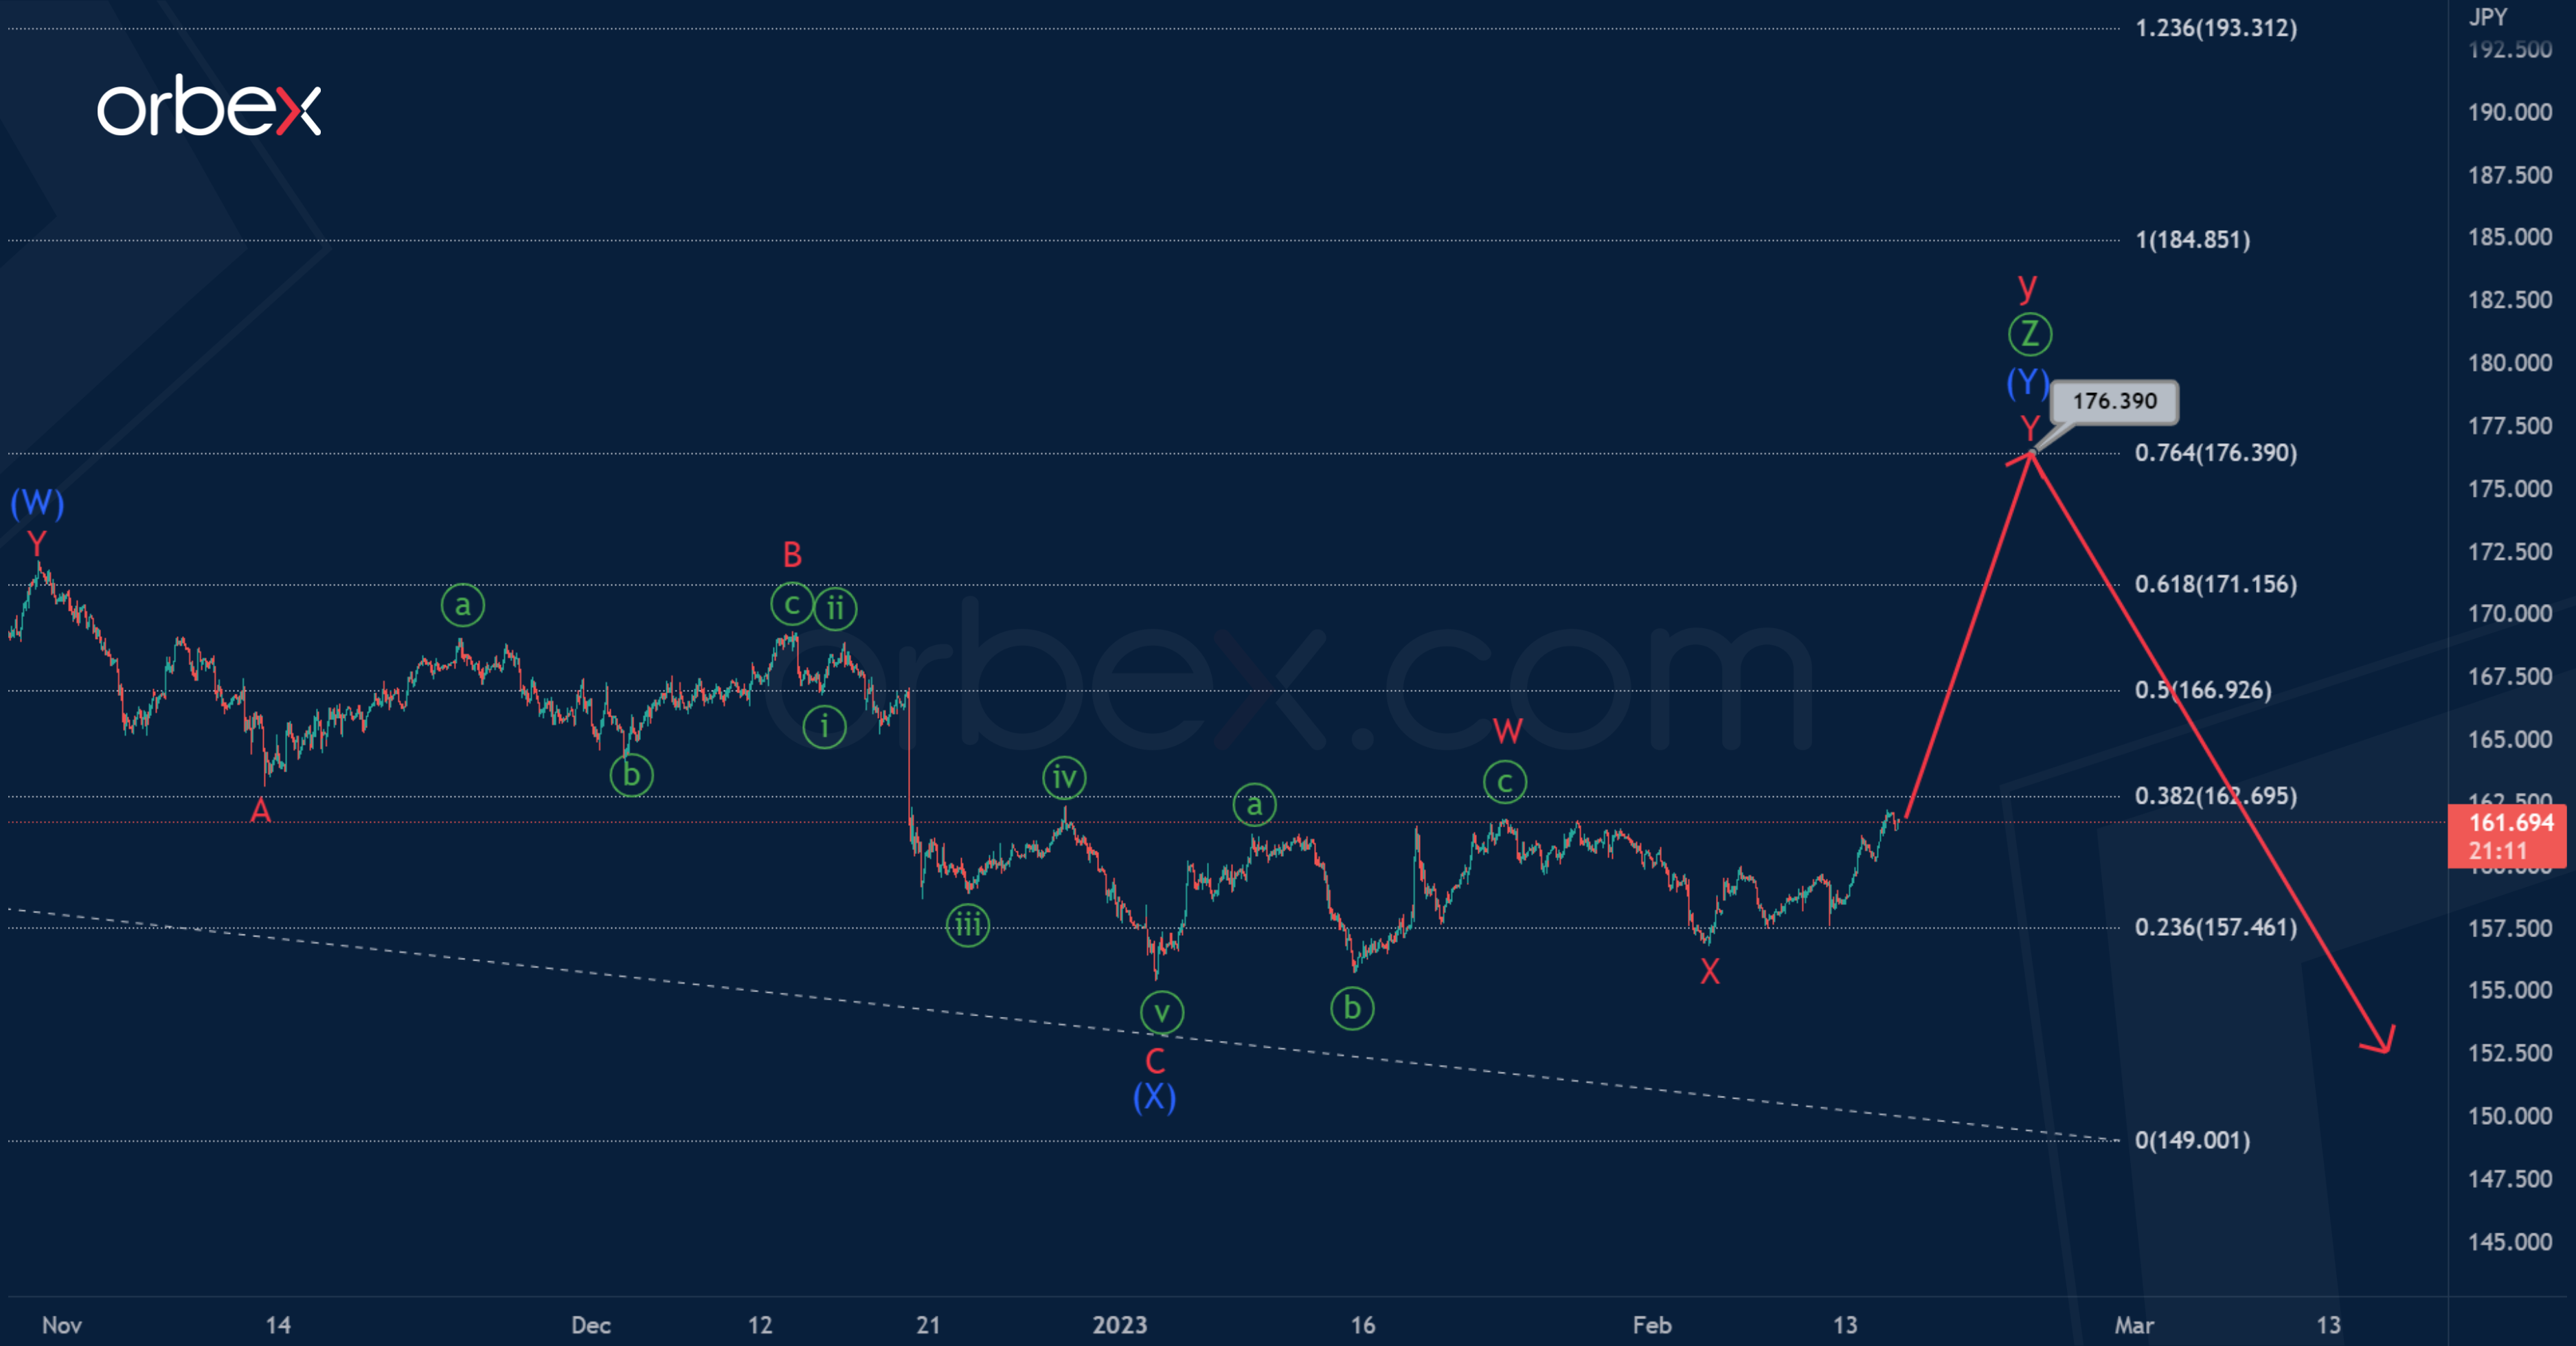
GBPJPY seems to be forming a large corrective triple zigzag Ⓦ-Ⓧ-Ⓨ-Ⓧ-Ⓩ pattern. The final wave Ⓩ could take the form of an intermediate double zigzag (W)-(X)-(Y).
It is assumed that two sub-waves (W) and (X) have already been formed. Now the last actionary wave (Y) is being built, which can take the form of a double zigzag W-X-Y. To complete this double zigzag , a minor sub-wave Y is needed.
Bulls are targeting the price of 176.39. At that level, wave (Y) will be at 76.4% of previous actionary wave (W).

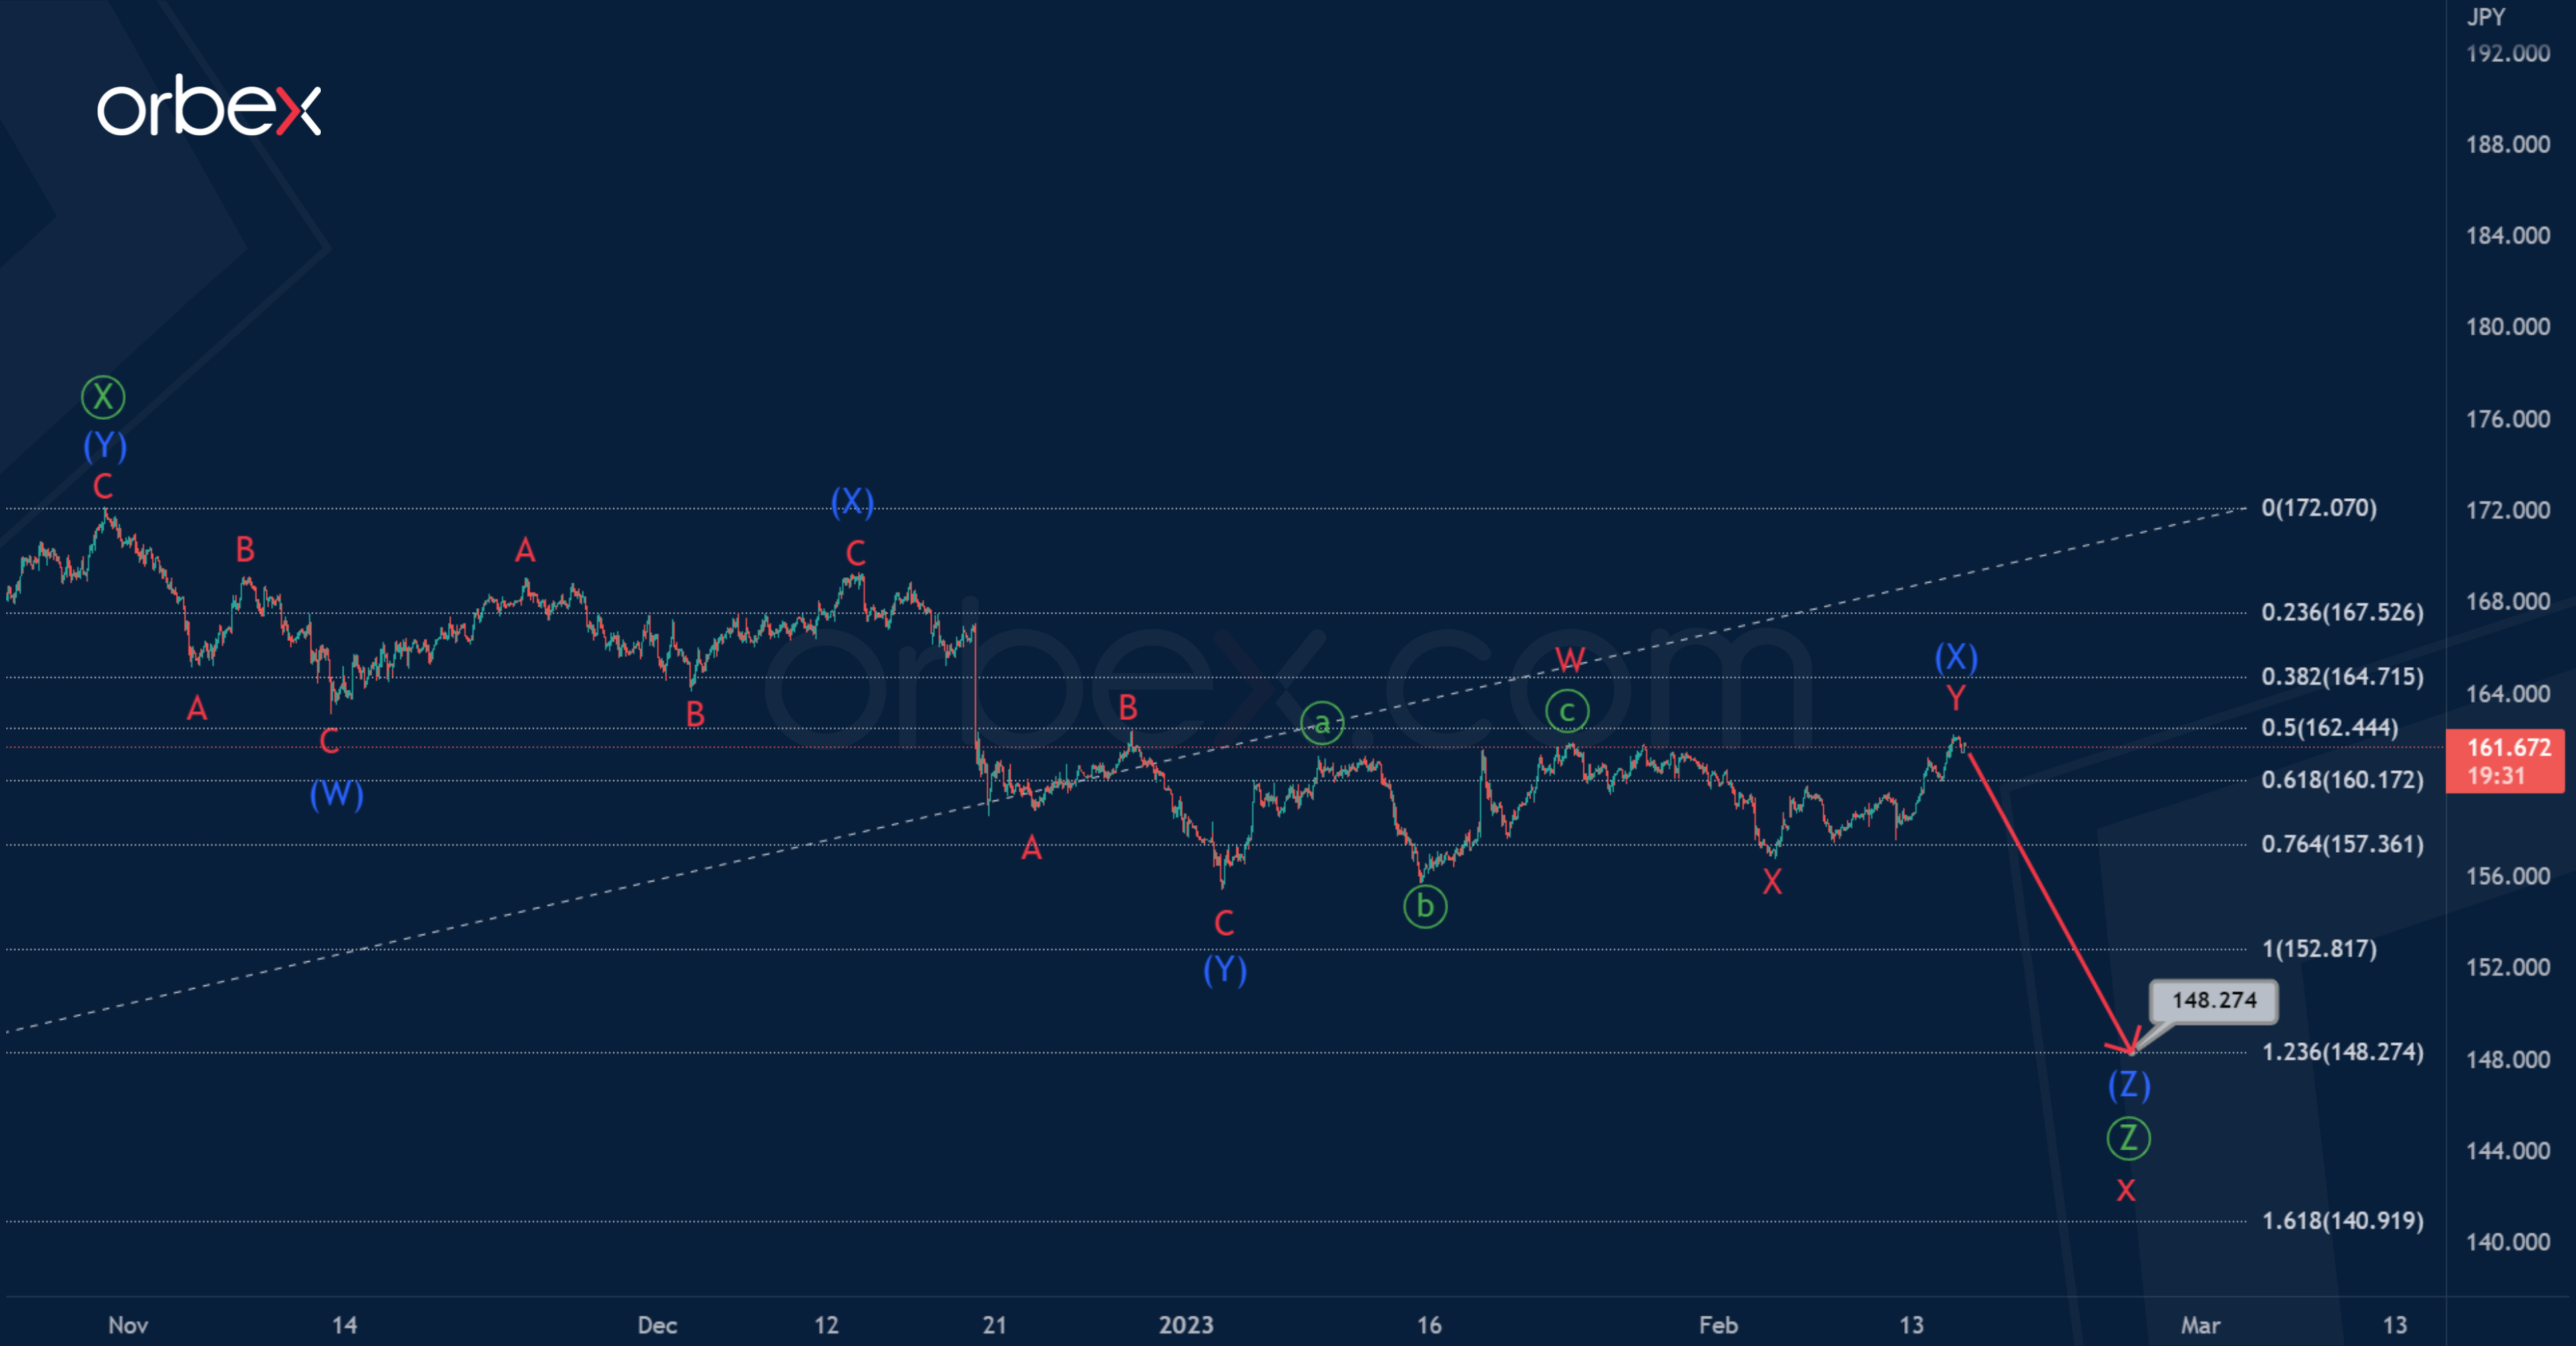
Let’s consider an alternative scenario, as seen above. According to this, a bearish intervening wave x is formed. It can end in the form of a triple zigzag, for the construction of which a final sub-wave Ⓩ is needed.
The current structure of the primary wave Ⓩ suggests an intermediate triple zigzag (W)-(X)-(Y)-(X)-(Z). The first four zigzag sub-waves have already been completed. In the near future, we expect a fall in the sub-wave (Z) to 148.27.
At the specified level, wave Ⓩ will be at 123.6% of actionary wave Ⓨ.

![Credit Card 160×600 [EN]](https://assets.iorbex.com/blog/wp-content/uploads/2023/06/13144507/Blog-Banner_EN-Banner_160X600X2.webp)