
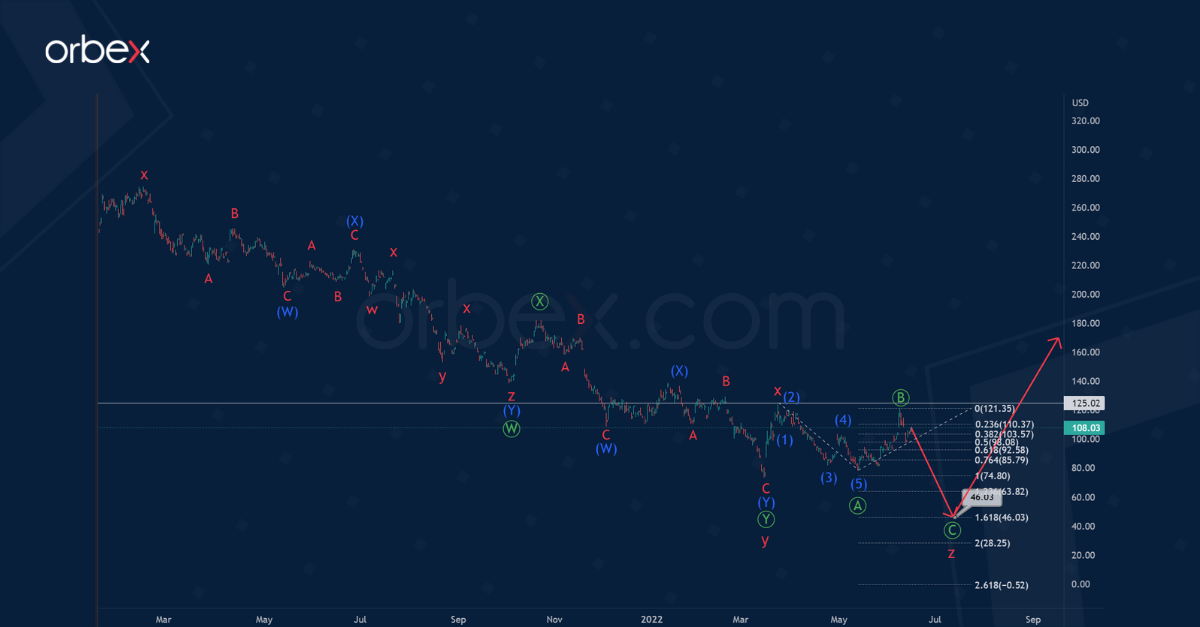
The internal structure of BABA shares hints at the formation of a bearish correction pattern. This takes the form of a cycle triple zigzag w-x-y-x-z.
Wave y has the form of a primary double zigzag Ⓦ-Ⓧ-Ⓨ.
The final actionary wave z takes the form of a primary standard zigzag Ⓐ-Ⓑ-Ⓒ, as shown in the chart.

The primary wave Ⓐ in the form of an intermediate impulse (1)-(2)-(3)-(4)-(5) has ended. Also, the construction of a small correction Ⓑ could come to an end. In the near future, shares could continue to fall in the impulse wave Ⓒ to the level of 46.03.
At that level, primary impulse wave Ⓒ will be at 161.8% of impulse Ⓐ.
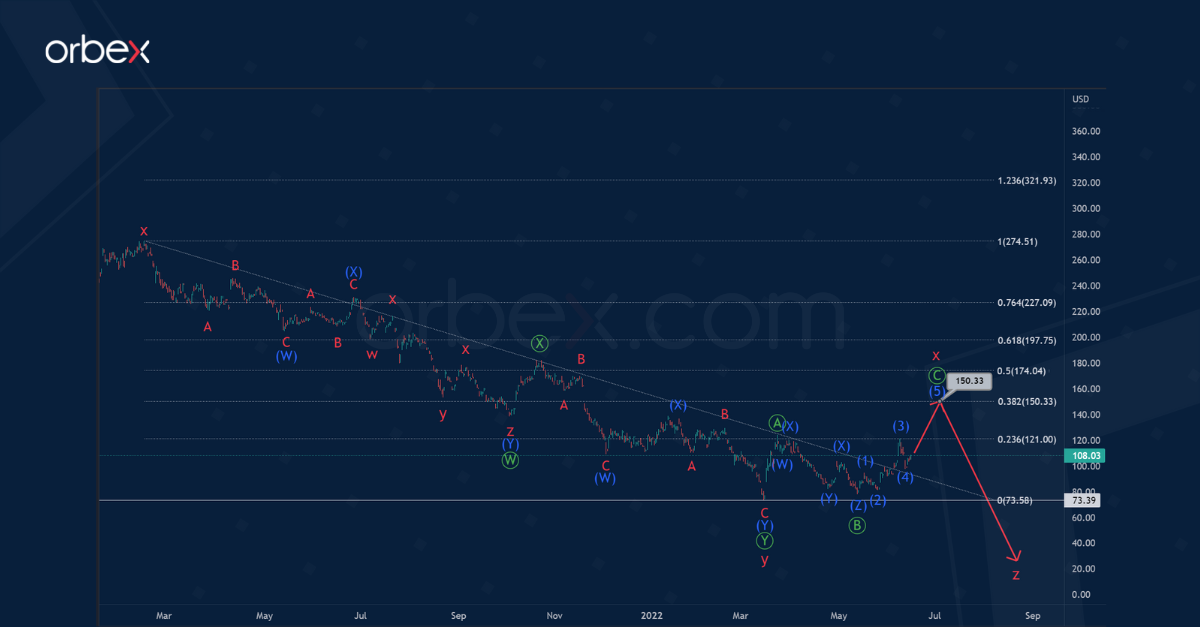
Alternatively, the formation of the cycle intervening wave x has not yet been completed. It could have a longer internal structure.
The intervening wave x could take the form of a simple Ⓐ-Ⓑ-Ⓒ zigzag of the primary degree. The correction wave Ⓑ is an intermediate triple zigzag.
In the near future, prices could rise in impulse Ⓒ to 150.33.
At that level, wave x will be at 38.2% of wave y. After the full completion of the cycle wave x, wave z could begin to decline below 73.39.

