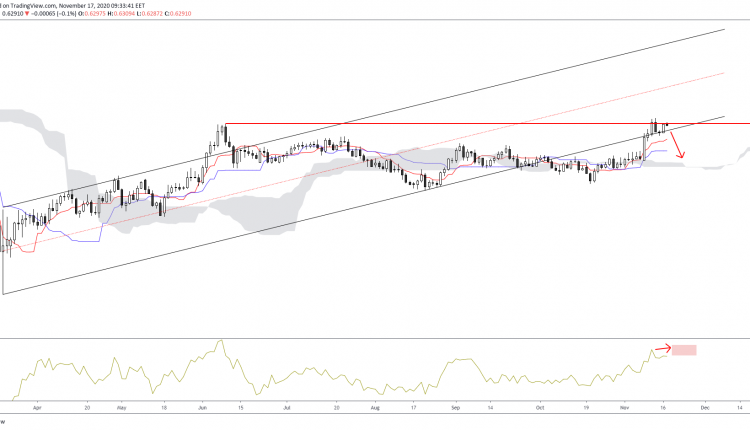
NZDCHF has witnessed a gradual ascension from its yearly low status in the first quarter. For most of October and November, prices fell out of the channel as the pair tested the 0.60 region.
The recent trend has seen a reverse into the specified channel. However, this has been met with resistance at the previous 0.63 high in June.
We now turn our attention to the momentum indicator. If momentum does increase, then this could make way for a hidden bearish divergence. This would lead prices back down towards the Ichimoku indicators, and once again test the recent lows.
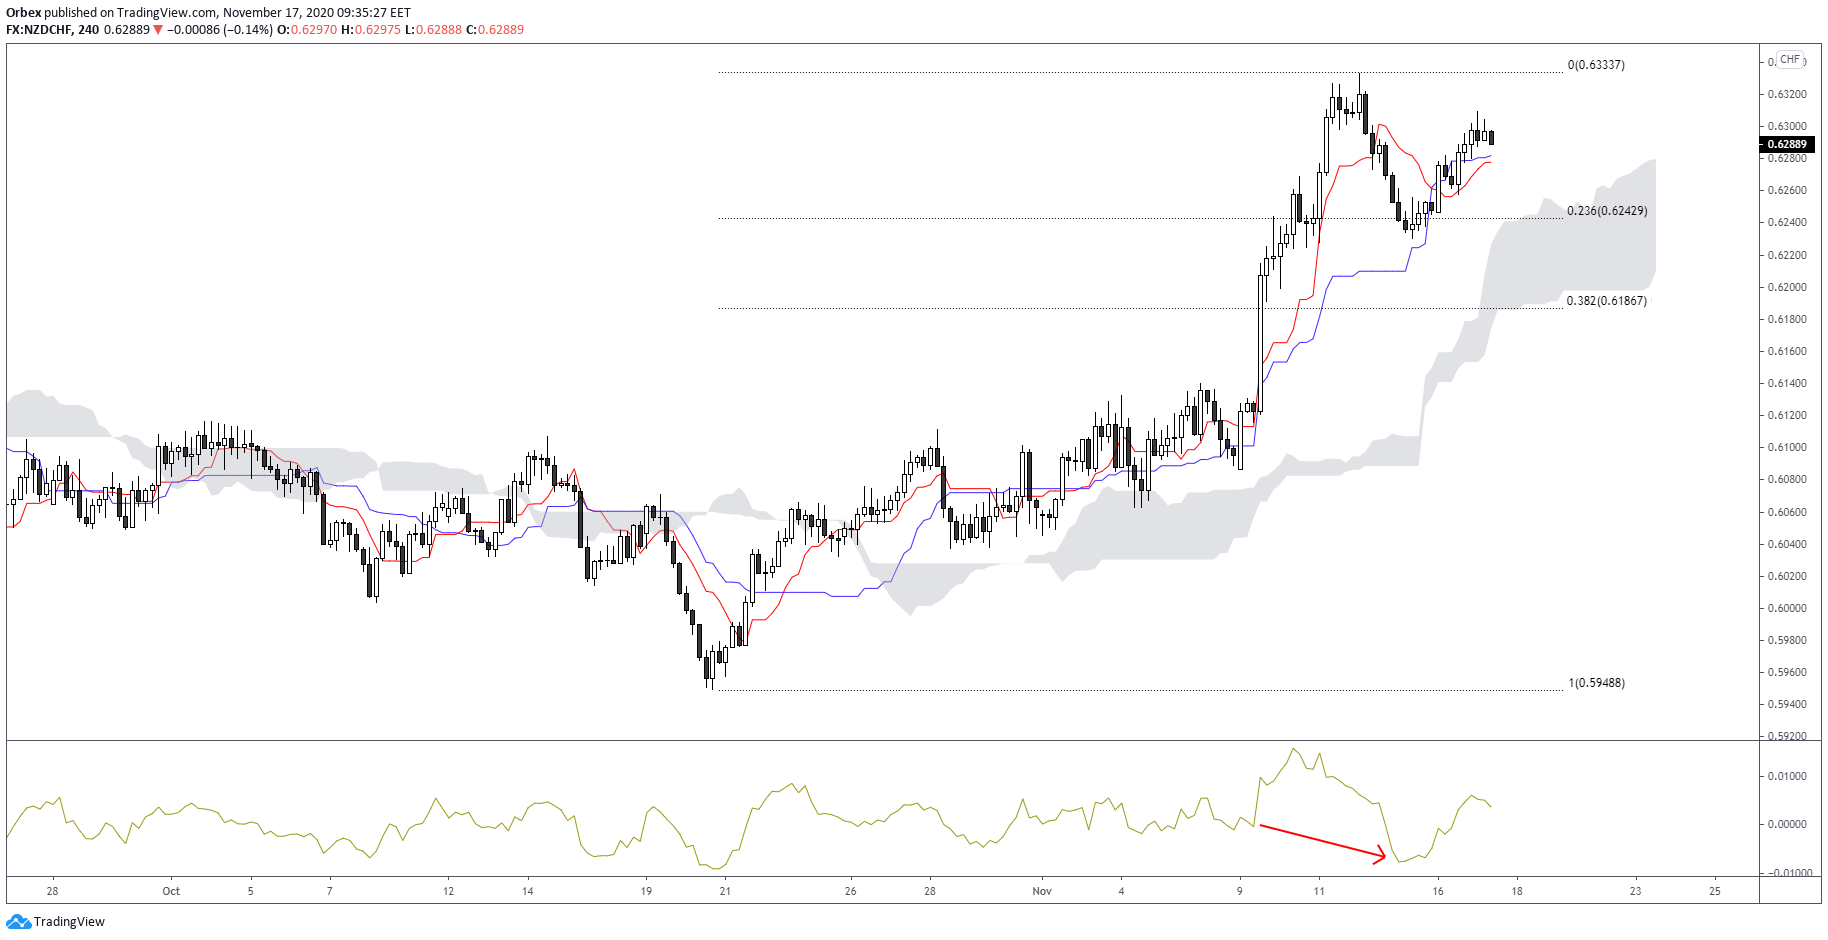

A look on the shorter-term perspective sees another possible attempt at the recent monthly high. Prices have bounced off the 23.6% of the 0.5948/0.6333 upside Fibonacci leg as the currency pair seeks further upside.
A recent hidden bullish divergence propelled the price as we now wait to see if another divergence will continue the trend.
However, should this be another failed attempt to reach the specified target, then bears will watch with a keen eye for any downside momentum.
A break through the 23.6% could lead to the 38.2%, which would then see cloud engulfment on the pair. This could then lead prices down to previous lows at the 0.60 area.

![Credit Card 160×600 [EN]](https://assets.iorbex.com/blog/wp-content/uploads/2023/06/13144507/Blog-Banner_EN-Banner_160X600X2.webp)