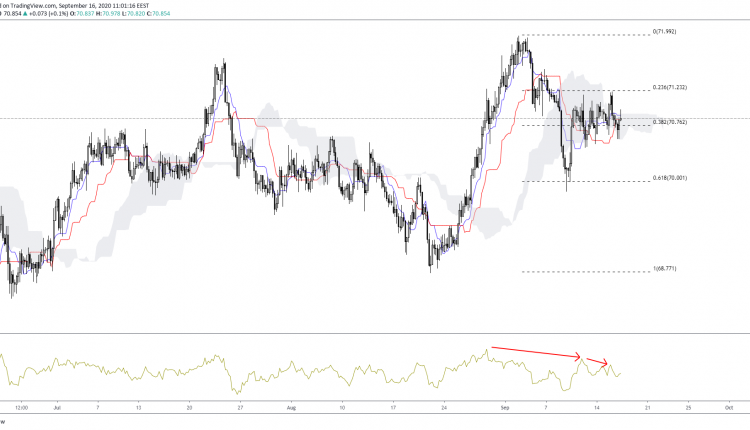
NZDJPY has recently witnessed fresh highs at $72. Since then, there has seen a pullback towards the $70 area as the pair is now consolidating.
As prices are currently engulfed in the Ichimoku cloud, we now look to a break out from the 38.2%/23.6% Fibonacci range.
The double divergence on the momentum indicator hints to a move below the 38.2% Fibonacci. Further weakness could see another test at the psychological $70 zone.
However, should a bounce occur at 38.2%, then another test at the recent resistance level at 23.6% could be expected. This could then lead prices towards the recent fresh highs once the $71 level is cleared.

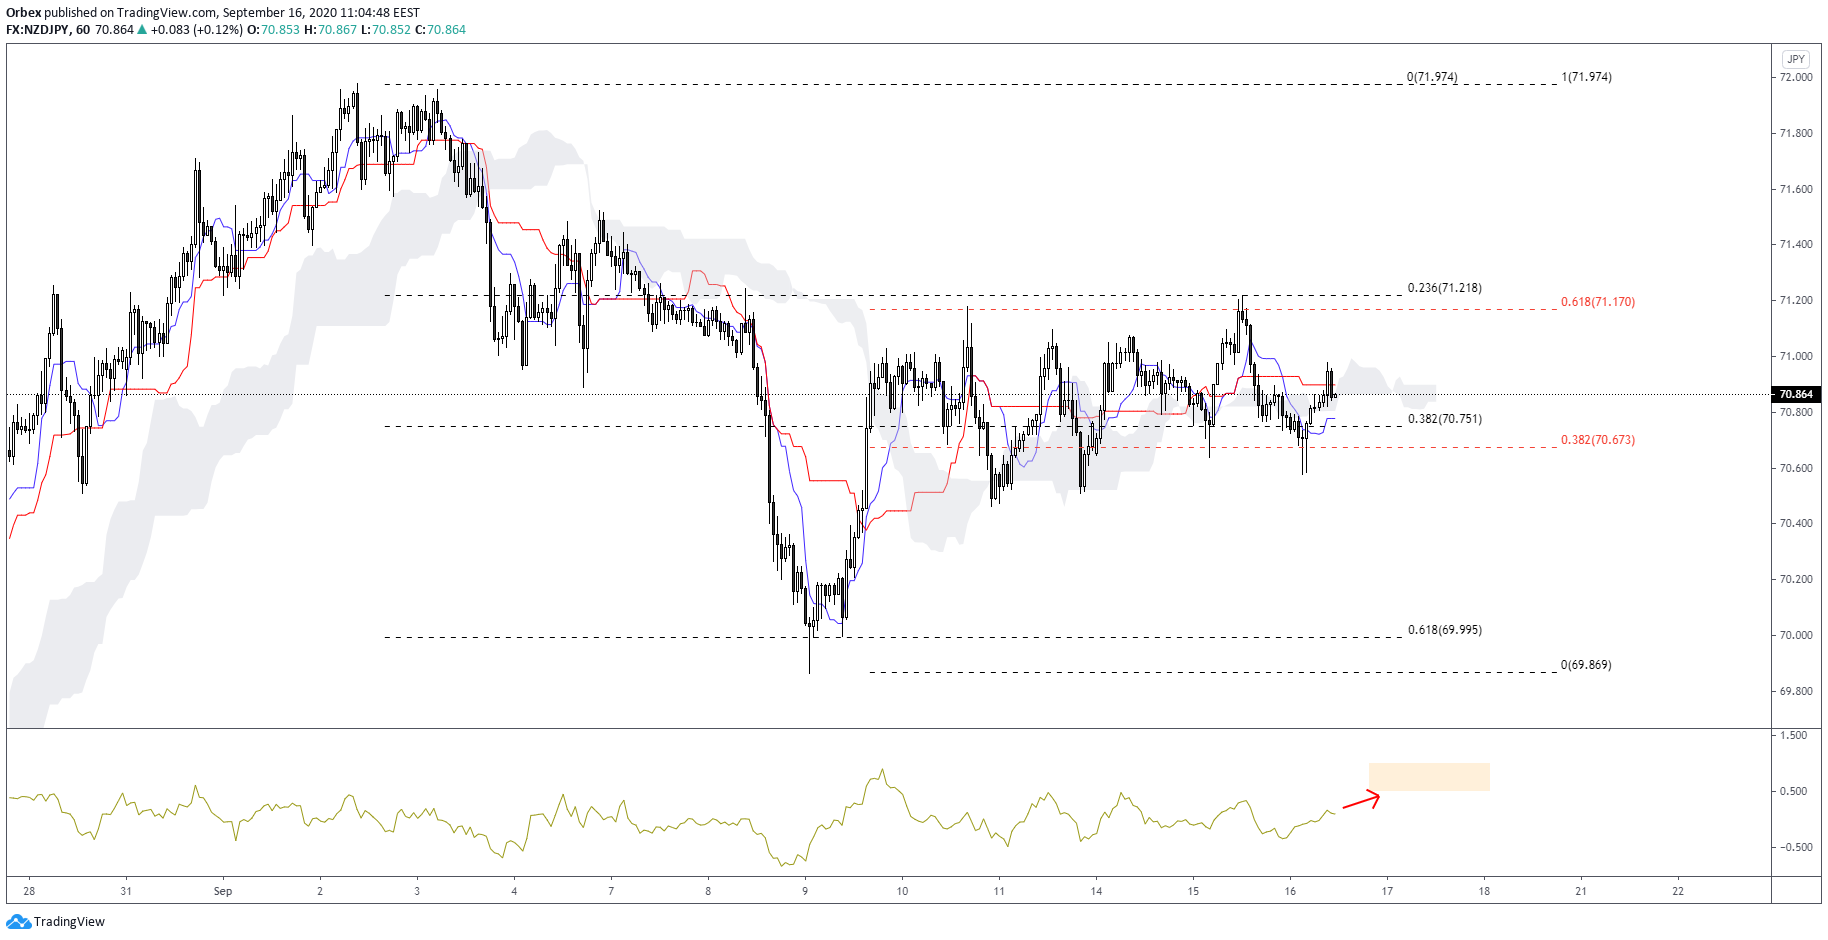
The 1-hour chart indicates prices are ranging in a sideways pattern. A short-term Fibonacci (71.974/69.869 leg) retracement shows confluence levels on the longer-term Fibonacci.
As we look for a breakout, we have seen valid support from both 38.2% Fibonacci legs.
However, the current momentum indicator shows an attempt to cross into higher values, forming a potential hidden bearish divergence. This could support the downside bias.
Should momentum exhaust and prices stay engulfed in the Ichimoku cloud, then another test at the support level could be likely. Bulls could send prices to test the recent false break on the upper confluence area. This could then bring the fresh highs back into play.

