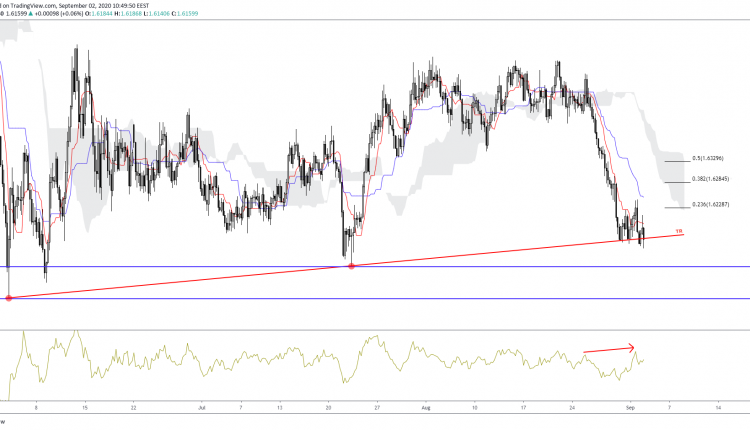
EURAUD has tested levels on a trend line that has been established since the beginning of June. Prices are currently breaking through the line as we look to the momentum indicator for further clues. The hidden bearish divergence could show that this is not a false break.
The first target would be the 1.61 range and then the main support level at 1.6029. With prices far away from the Ichimoku cloud and trading below the Tenkan and Kijun lines, further downside is likely.
Should a bounce on the said support levels occur, then the first target could be the 23.6% line of the 1.6520/1.6136 Fibonacci Retracement leg.
However, prices are not expected to climb higher than the 50% area as short bets are likely.

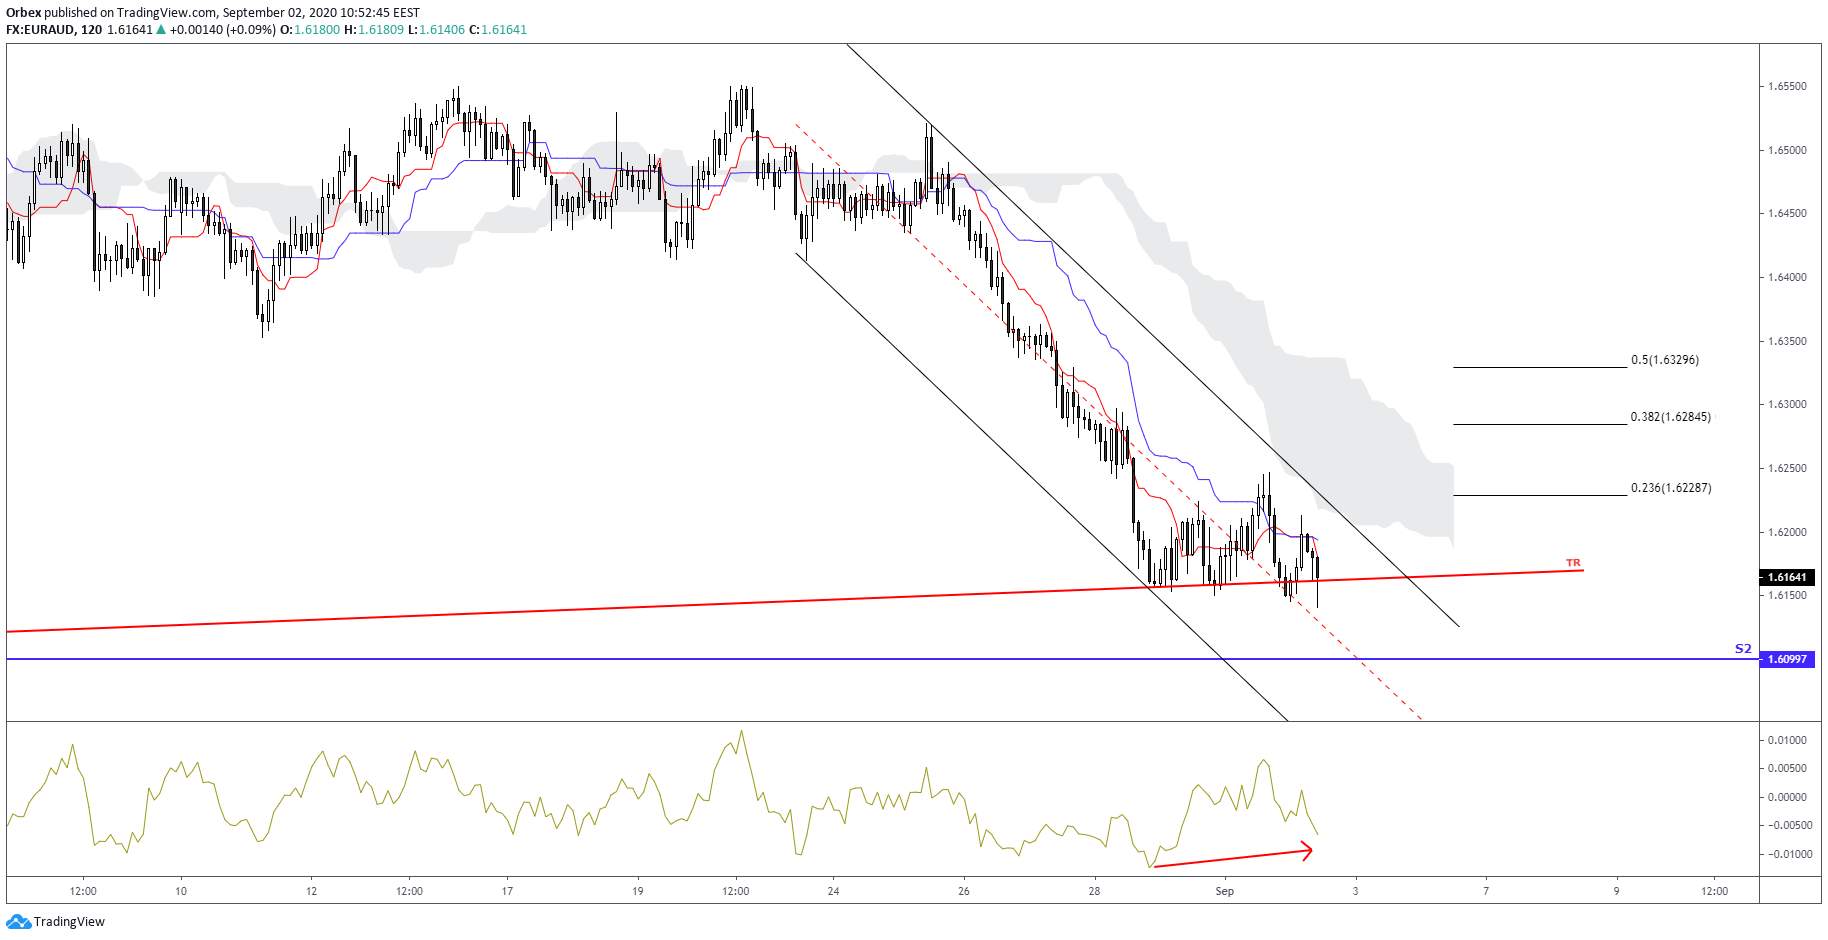
The shorter-term chart looks at a channel formation to the downside. The prospect of a continuation lower sees prices having already tested the lower regression line.
However, we are currently seeing a bullish divergence on the momentum indicator. This could bring prices up towards the 23.6% long term Fibonacci retracement area. A move to this level would see prices touch the Tenkan and Kijun confluence level, indicating further upside.
Similar to the previous long-term outlook chart, prices are not expected to reach beyond the 50% Fibonacci line. This indicates a continuation to the downside that would negate the current divergence on the momentum indicator.

