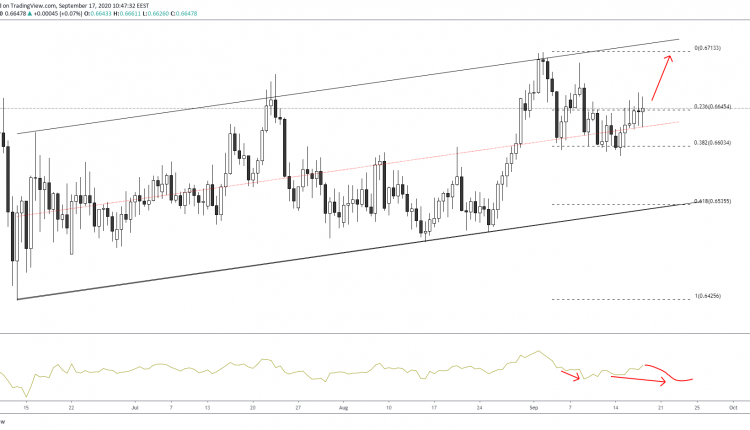
AUDCHF has been trading in an ascending channel from the middle of June.
Since then, we have witnessed several attempts to break the upper line. The lower channel has also been tested as prices move away from the psychological 0.65 area.
Since the last attempt at the break of support, bulls have moved to the 0.67 region. The recent hidden bullish divergence on the momentum indicator has aided the move.
Prices now range between the 38.2% and the 23.6% Fibonacci of the 0.6425/0.6713 retracement leg. The median regression is acting as a support level as we now look for further clues if prices can remain above 0.66.

Should another divergence appear on the momentum indicator, then prices could be expected to attempt another test to the upper channel.
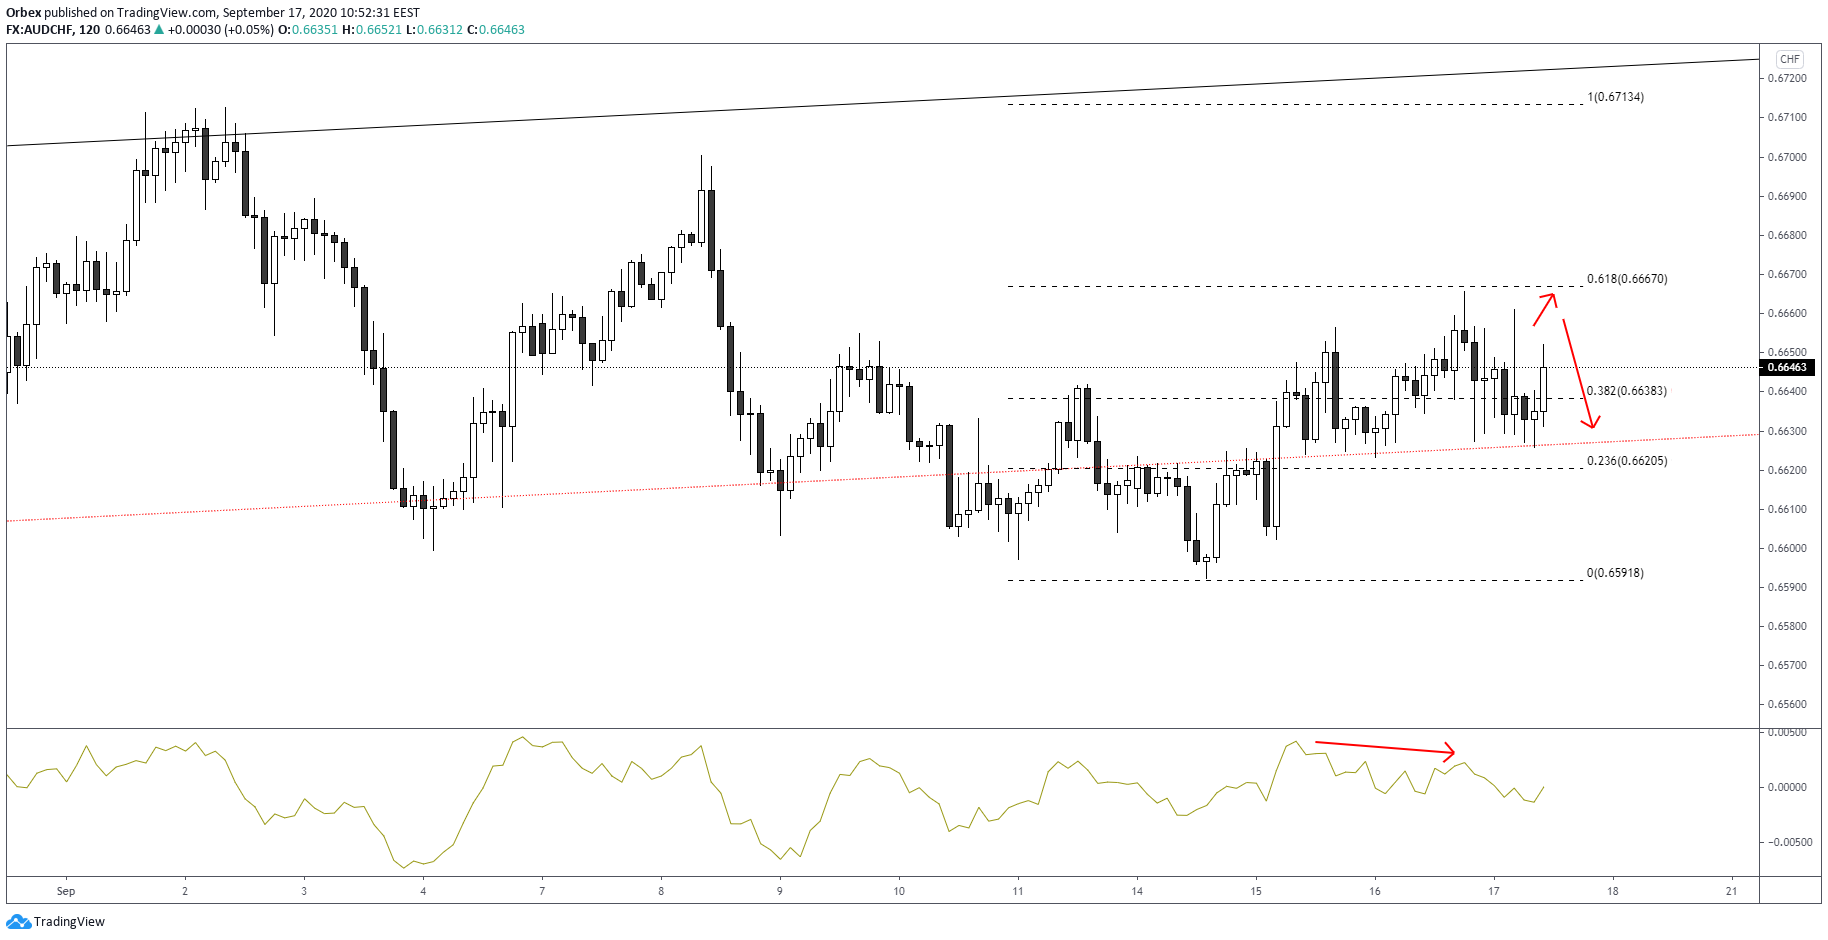
A short-term perspective hints to resistance at the 61.8% Fibonacci. This is taken from the monthly high and low, creating the 0.6713/0.6591 retracement leg.
Should another attempt at the 0.6667 resistance area fail, then prices could be likely to drop to 38.2%. The median regression will once again act as a possible support should there be further downside.
A bearish divergence supports the move to the downside. This will be an early indication if the pair can once again reach monthly lows.

