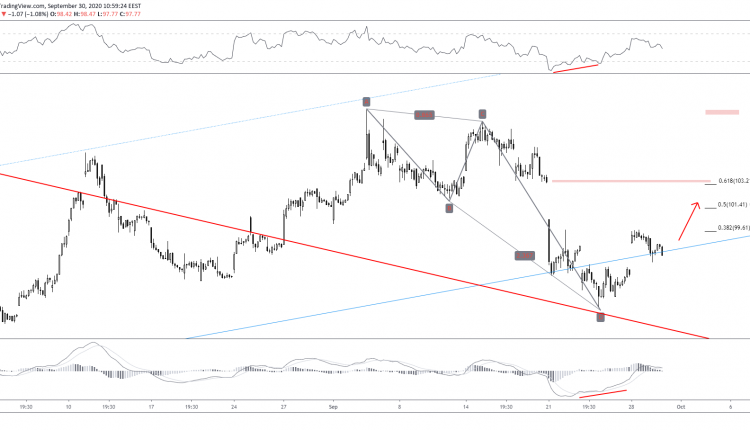
AMEX’s decline since January may look bearish to most analysts.
However, prices have remained above the descending trend line connecting the higher lows since August’s bullish breakout. In addition, the bearish ABCD pattern formed from 109.06 down to 93.77 missed retesting the trend line, suggesting weaker bears.
With both indicators showing a bullish divergence, an ascending regression channel seems to be on its way to fresh highs, filling the gap above the 100 mark – at least. The gap level at 103 is also a cluster.
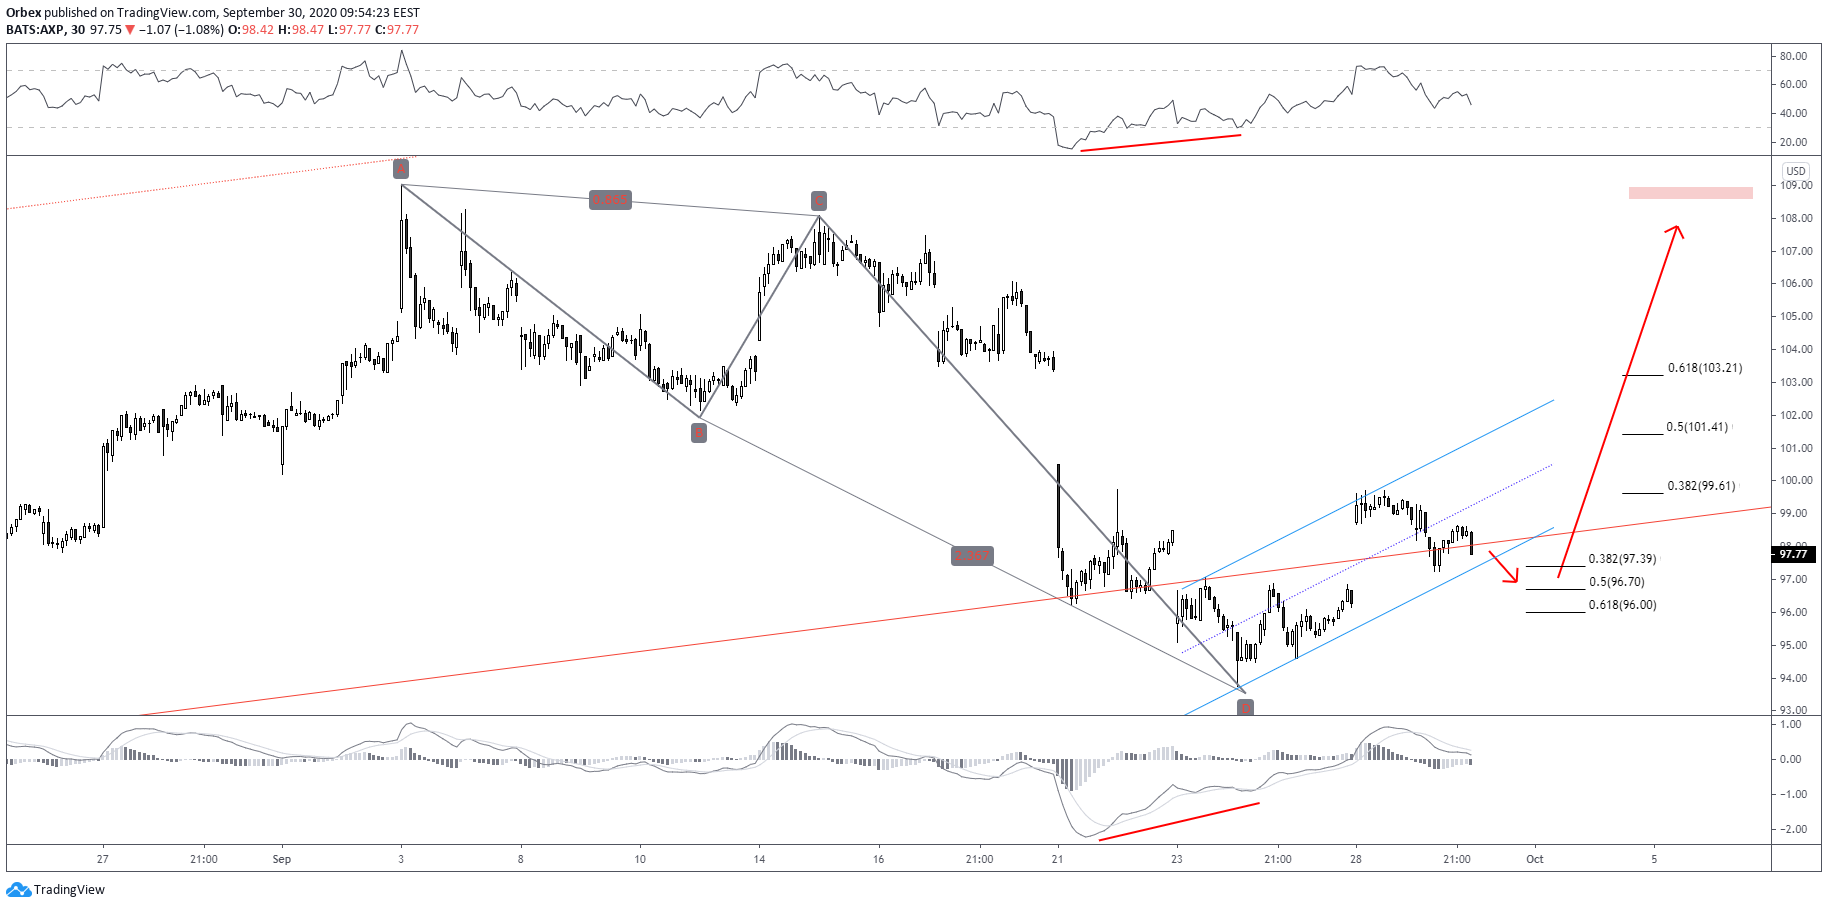

The rejection at the 38.2% Fibonacci of the ABCD pattern could send AMEX a tad lower indeed. However, we are looking for prices to remain constrained near the 50% Fibonacci of the 3-wave upside leg to 99.61.
Despite prices remaining outside the longer-term ascending channel, this could turn out to be a simple false break.
Validation could be provided following a bounce anywhere above the previous swing low. We do expect the 96.00 to hold, however, providing necessary support to bulls.

![Credit Card 160×600 [EN]](https://assets.iorbex.com/blog/wp-content/uploads/2023/06/13144507/Blog-Banner_EN-Banner_160X600X2.webp)