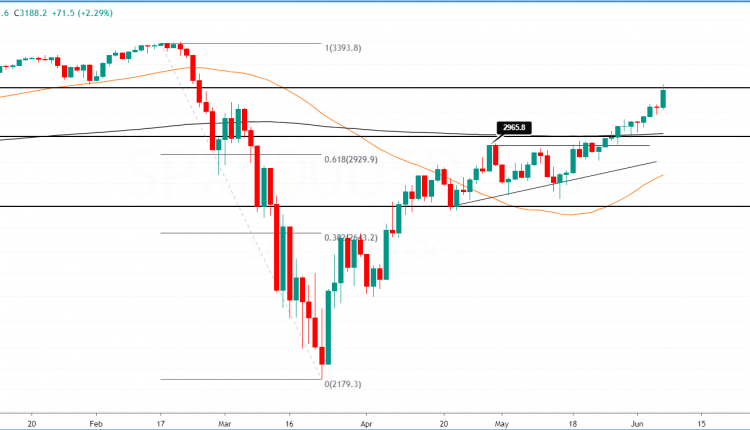
The S&P500 managed to hit the ascending triangle chart pattern target of 3188 last week. The gains came on a successful breakout of the resistance level near 3000.
With minimum retracement, the stock index moved steadily higher toward the target.
Following this stellar rise, the question is now whether the index can continue to recover and post higher highs. The price levels of interest are not between 3188 and 3000. Ideally, a retracement to the 3000 level to establish support will be a perfect opportunity to buy into the dips.
But, given the strong momentum, there is scope for a continuation. Above 3188, the S&P500 index will likely continue rising to February highs of 3383.

However, a lot of this will depend on whether the index can break past the 3188 level convincingly.

![Credit Card 160×600 [EN]](https://assets.iorbex.com/blog/wp-content/uploads/2023/06/13144507/Blog-Banner_EN-Banner_160X600X2.webp)