The Canadian dollar has recovered a good portion of its losses against its American counterpart since the March 19th, 2020, high at 1.4668.
USDCAD has maintained a sell-the-rally bias since then. The bearish move towards 1.39 is now supported for USD and CAD via the DXY and WTI structures.
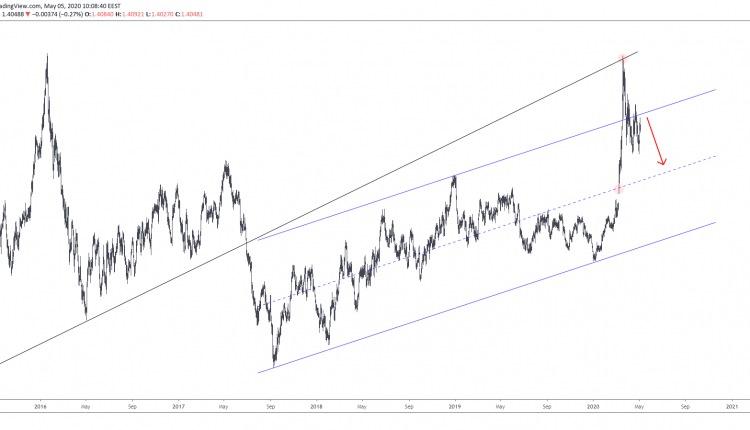
Loonie’s 12-hour chart above suggests that the recent recovery of the greenback is weak. Prices fell within the ascending channel dated Sep 7, 2017. And any attempts to break higher failed as well.
However, we do remain skeptical. The pair still trades near the channel trendline and above the 1.40 round support too.

USDCAD rising from a low of 1.3850 following a double bottom to a high of 1.4150 makes the 300-pip zone very interesting.
A closer look at the 4-hour chart below validates the interest.
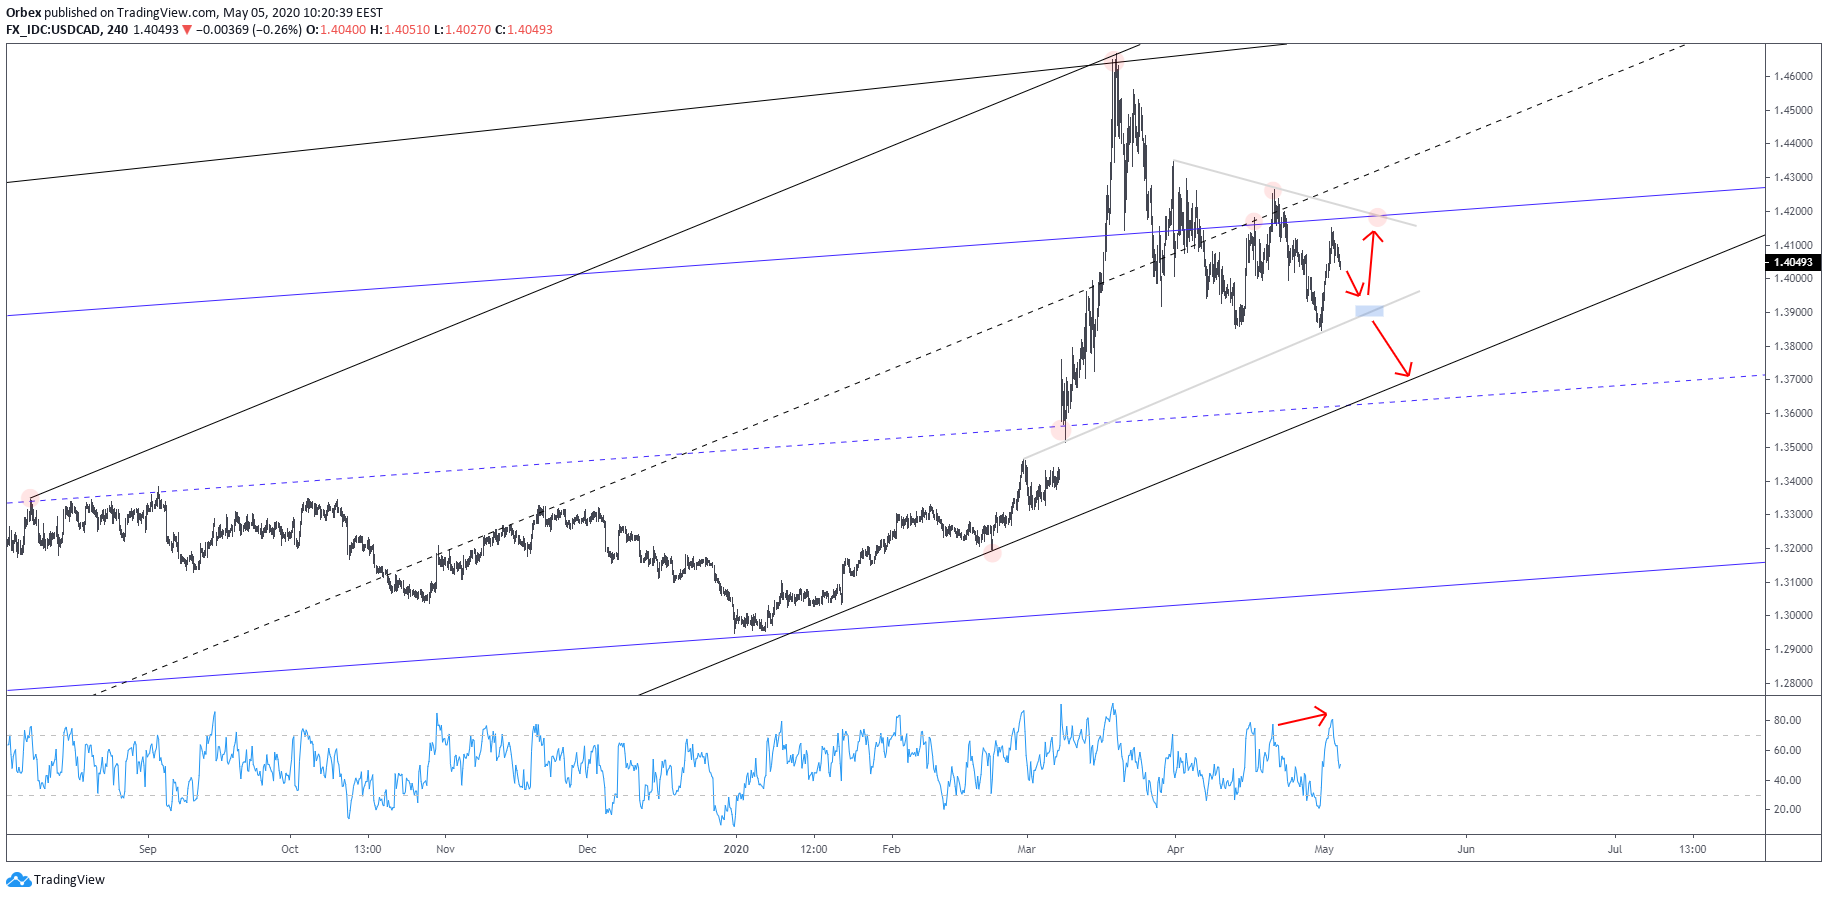
USDCAD is better placed to extend down towards the 1.39 trendline, than up towards the 1.41 region. However, the former assumes that the recent upside to 1.4150 is a test of the descending trendline connecting the 1.4350 and 1.4170 tops.
The likelihood of meeting more buyers at the 1.39 intersection is higher than meeting more buyers at the current levels. However, with a short-term decline, we can expect the activity at the 1.40 round support to determine the pair’s course.
When looking at the test to 1.4150 as a weak attempt to take out the descending trendline, there is a good chance that prices are going to reach the intersection with the top trendline of the ascending channel dated Sep 7, 2017.
The question is whether this happens before a test of the ascending trendline near 1.39, or after.
In either case, we could expect a break to lower lows as well. We could reach levels below 1.38, as the RSI remains biased to the downside.