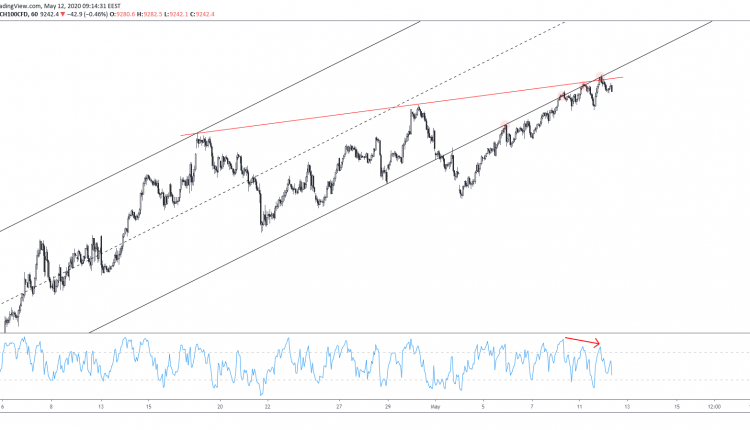
NASDAQ only missed the 9375 top by a few pips. However, that follows multiple attempts to break the ascending channel starting Mar 26. That suggests a reasonable failure as the lower channel has been a hurdle for bulls since May.
Despite price action looking bullish medium-term, the ascending trendline connecting the most recent swing highs adds to the weakness. This is because it meets the lower channel and prices at 9315, as seen above.
This makes the intersection a strong confluence region. And when followed by a false break at 9348, the chances of at least a short-term decline increase.
Going lower down for a short-term view, the current price action seems to be supportive.

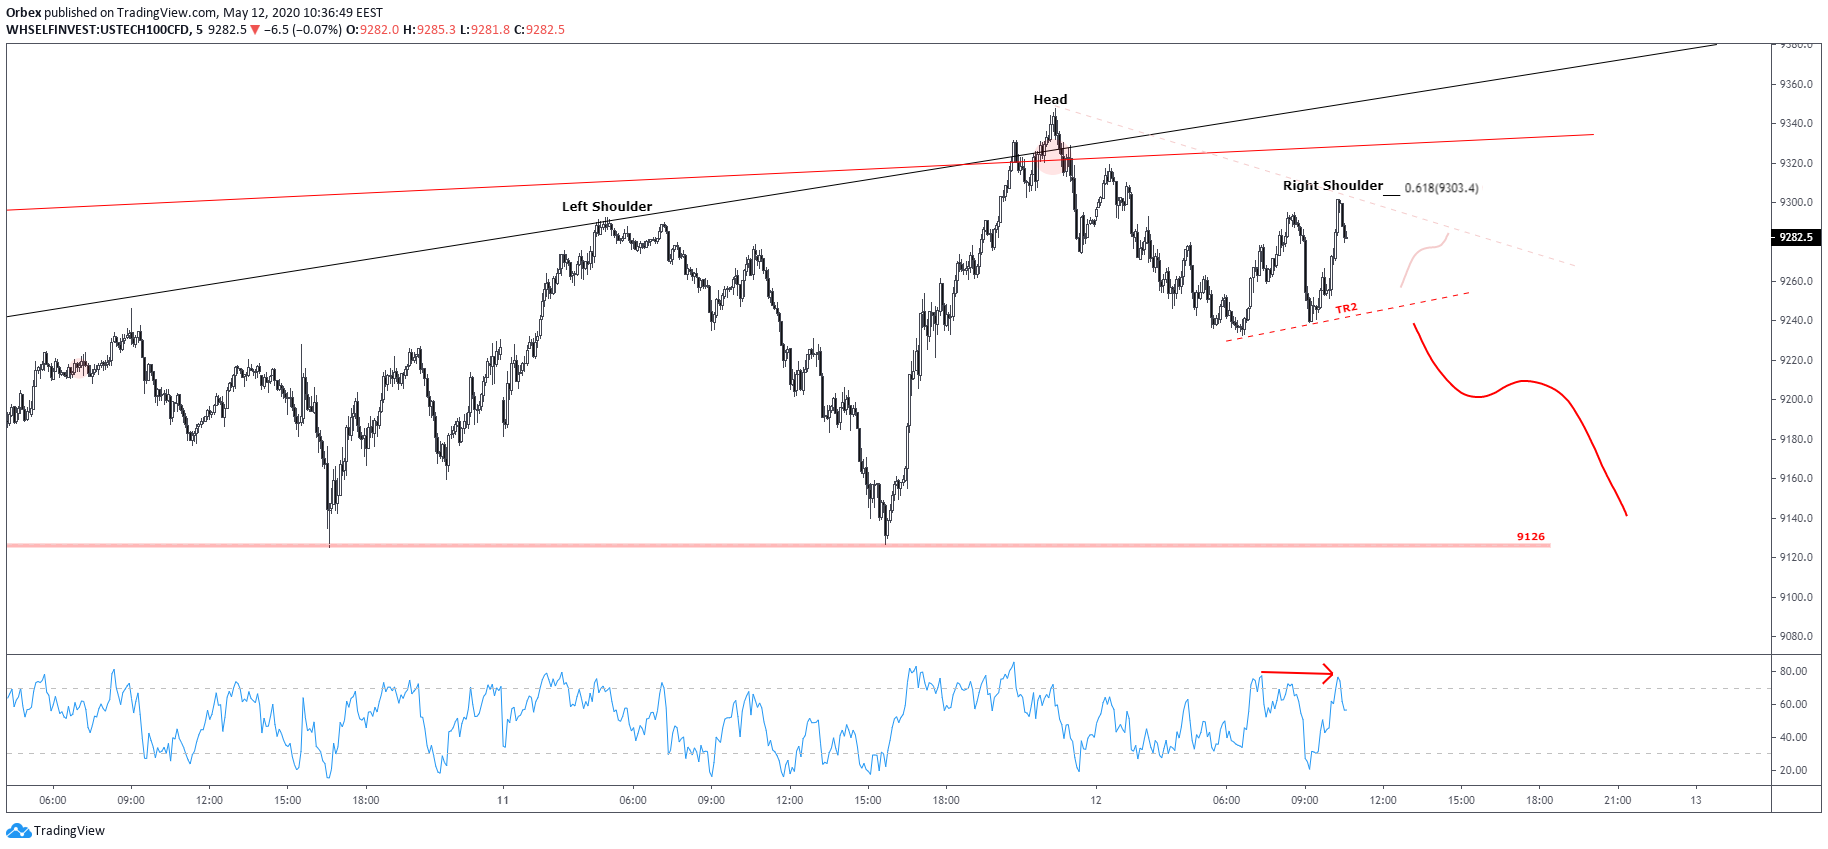
The structure resembles an upcoming head and shoulders pattern. All top formations seem completed and now we can expect prices to move down to the neckline. The neckline lays at 9126 and constitutes the first downside targets. Next is the 61.8% Fibonacci near the around 9000 level.
In the shorter-term, the most recent bullish retracement stopping at the 61.8% Fibonacci retracement near 9300 seems bearish. Thus, we can expect a break above to invalidate the idea, at least in the short-term. At the end of the day, the right shoulder could come after prices revisit the neckline.
A break of the 9232 swing low could get is to the TR2 descending trendline for a retest before breaking to fresh lows.
On the upside, an early signal of invalidation is the descending trendline from the head to the right shoulder. Revisiting that level, will either allow a break higher, likely invalidating the pattern, or lead to a delayed bearish continuation towards 9126.

