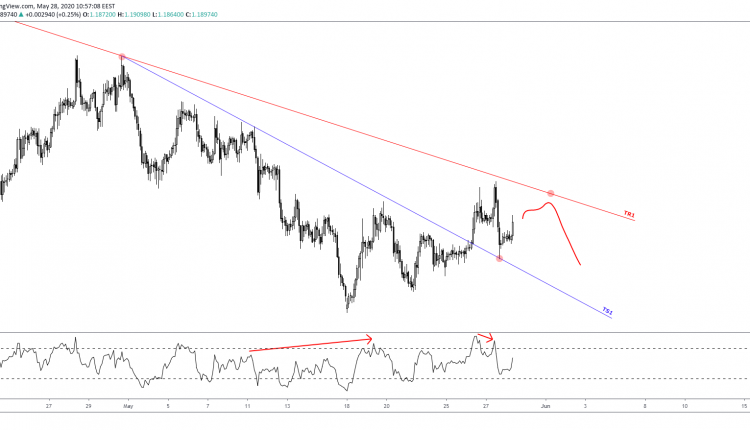
GBPCHF has been bearish since the 1.33 top reached on Dec ’19.
With prices trading near the trendline resistance TR1 starting Feb 18, ’20 we could see the pair moving up for a retest as the bullish attempt on May 27 was weak.
Despite prices having broken outside the trendline support TS1 starting Apr 30 and having retested it only a break of the TR1 trendline could lead to fresh highs.
In the short-term, we can expect prices to continue higher towards the 1.1950 area before sliding lower. This is unless the rejection at the 50% retracement near 1.19 weighs on the pair.

In that case, we can expect the 1.1850 to break first and then look for a retest at the lower channel. From there, we could slide lower towards 1.1750.
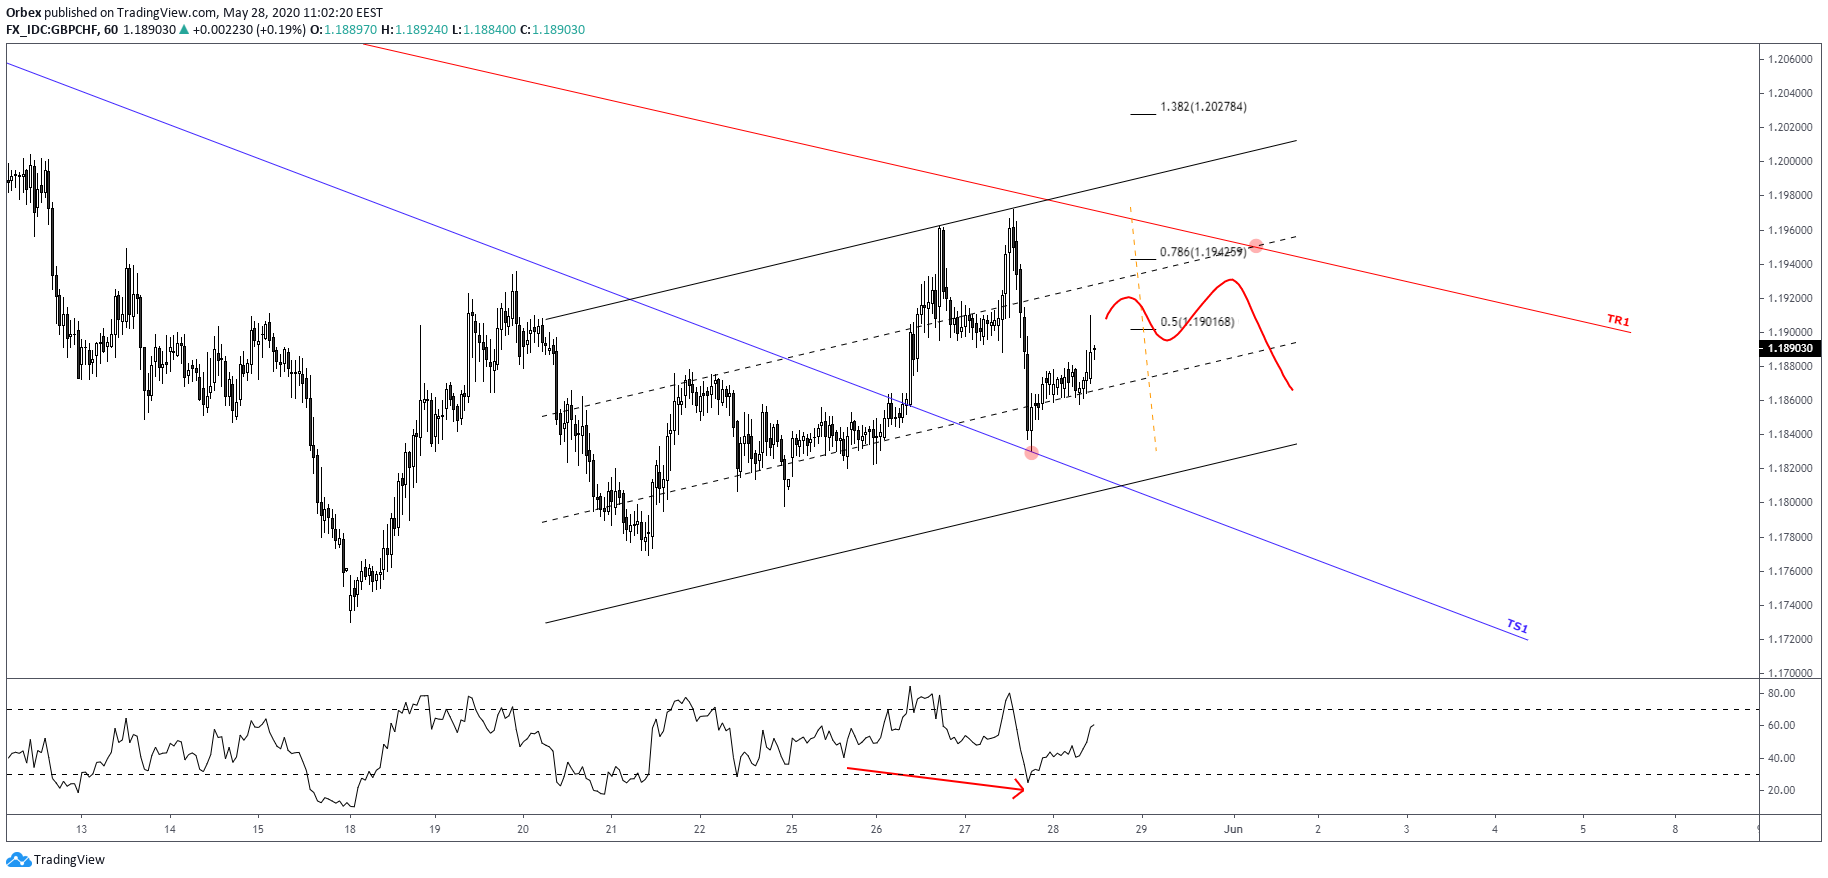
That said, the channel carrying the pair higher though indicates that the 1.1950 is a confluence level.
There, we can see the TR1 trendline, the 78.6% Fibonacci, and the upper regression line of the channel coming together. This makes the level more attractive, which suggests an upside first.
The RSI (9) also supports the narrative as it shows a bullish hidden divergence.

![Credit Card 160×600 [EN]](https://assets.iorbex.com/blog/wp-content/uploads/2023/06/13144507/Blog-Banner_EN-Banner_160X600X2.webp)