USD/CAD Elliott Wave Structure is possibly revealing a Flat Pattern which seems to align with the Fibonacci measurements approximately around the 1.310 Level.
The big picture points towards the fact that USD/CAD has started a larger degree Correction labeled as Cycle Wave IV (green).
USD/CAD –Weekly Chart:
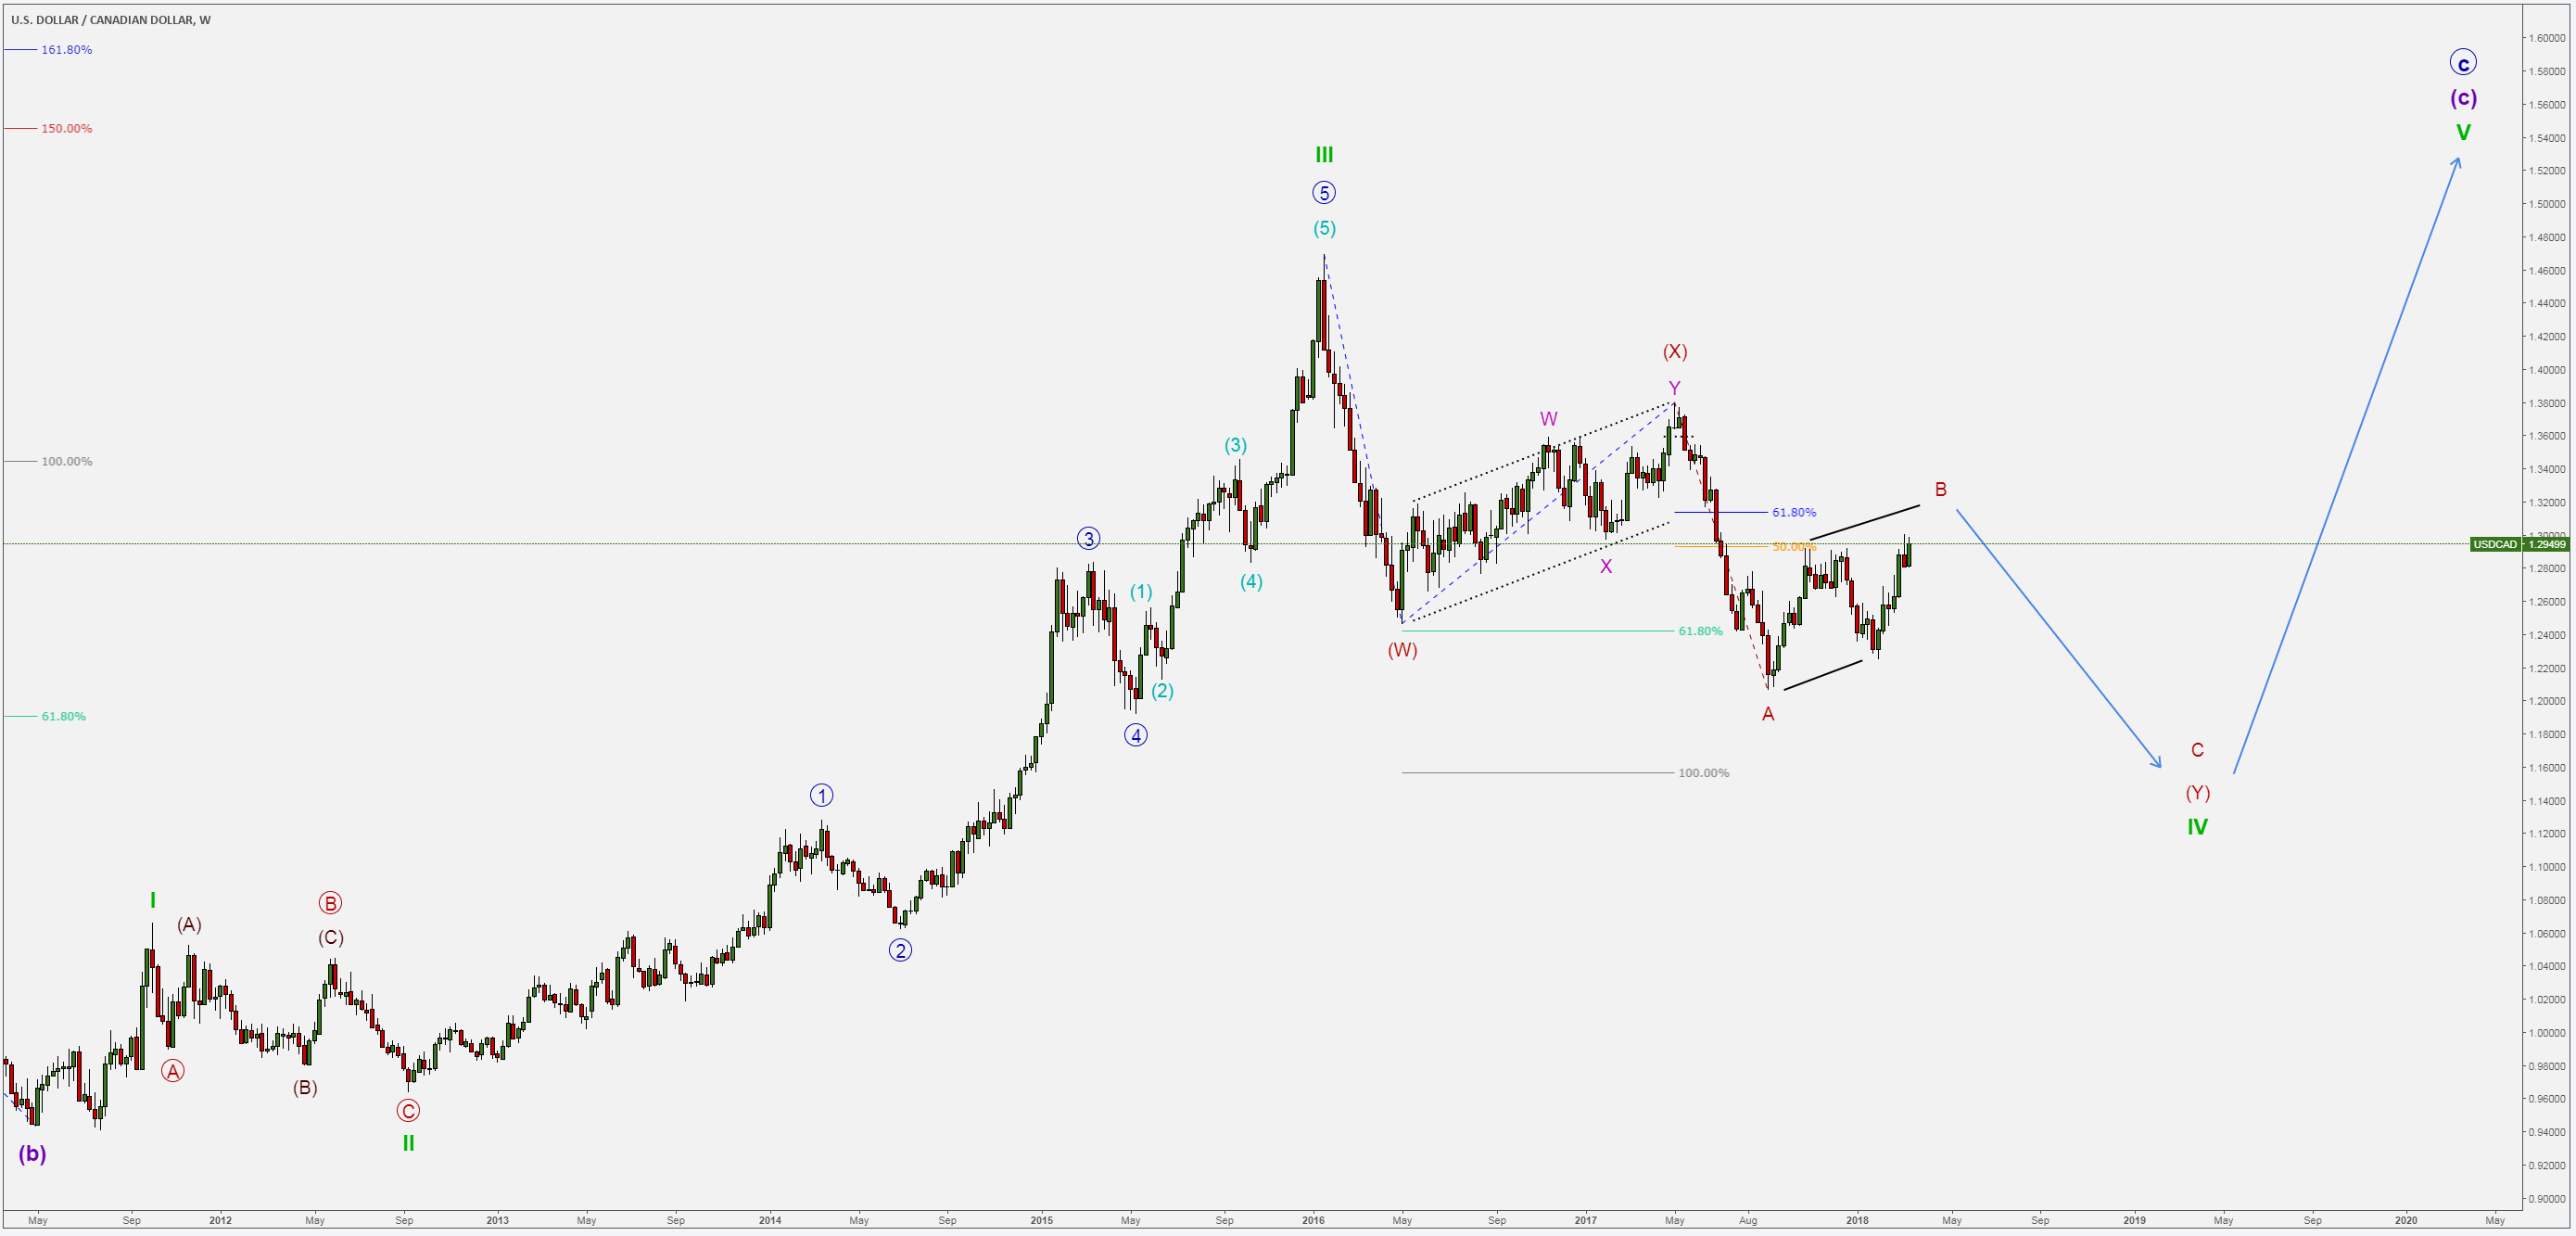

Elliott Wave Long-Term Analysis:
- 18th Jan 2016 until 2nd May 2016 – The sell-off was is labeled as Intermediate (W) (red).
- 2nd May 2016 until 1st May 2017 – Previous sell-off was corrected slowly for an entire year, this leading towards labeling the Channeling Complex Corrective as Intermediate (X) due to time cycles.
Moving in for a closer look, one may see that after the Complex Double Three in Intermediate (X) (red), the Bears gained control once more and continued the down-trend. This bearish Swing is labeled as Minor A (red).
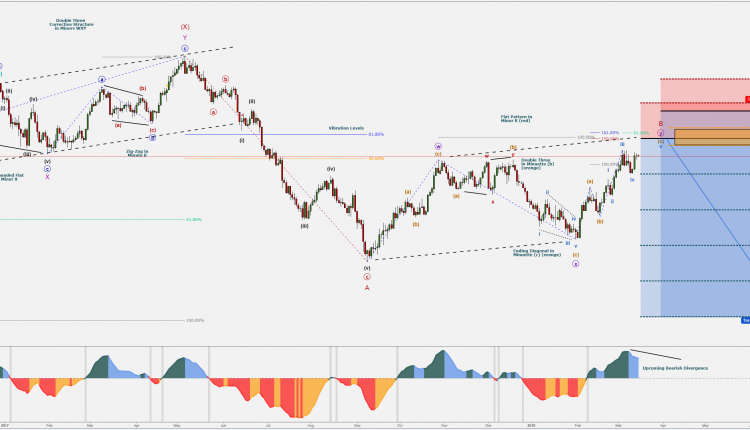
USD/CAD –Daily Chart:
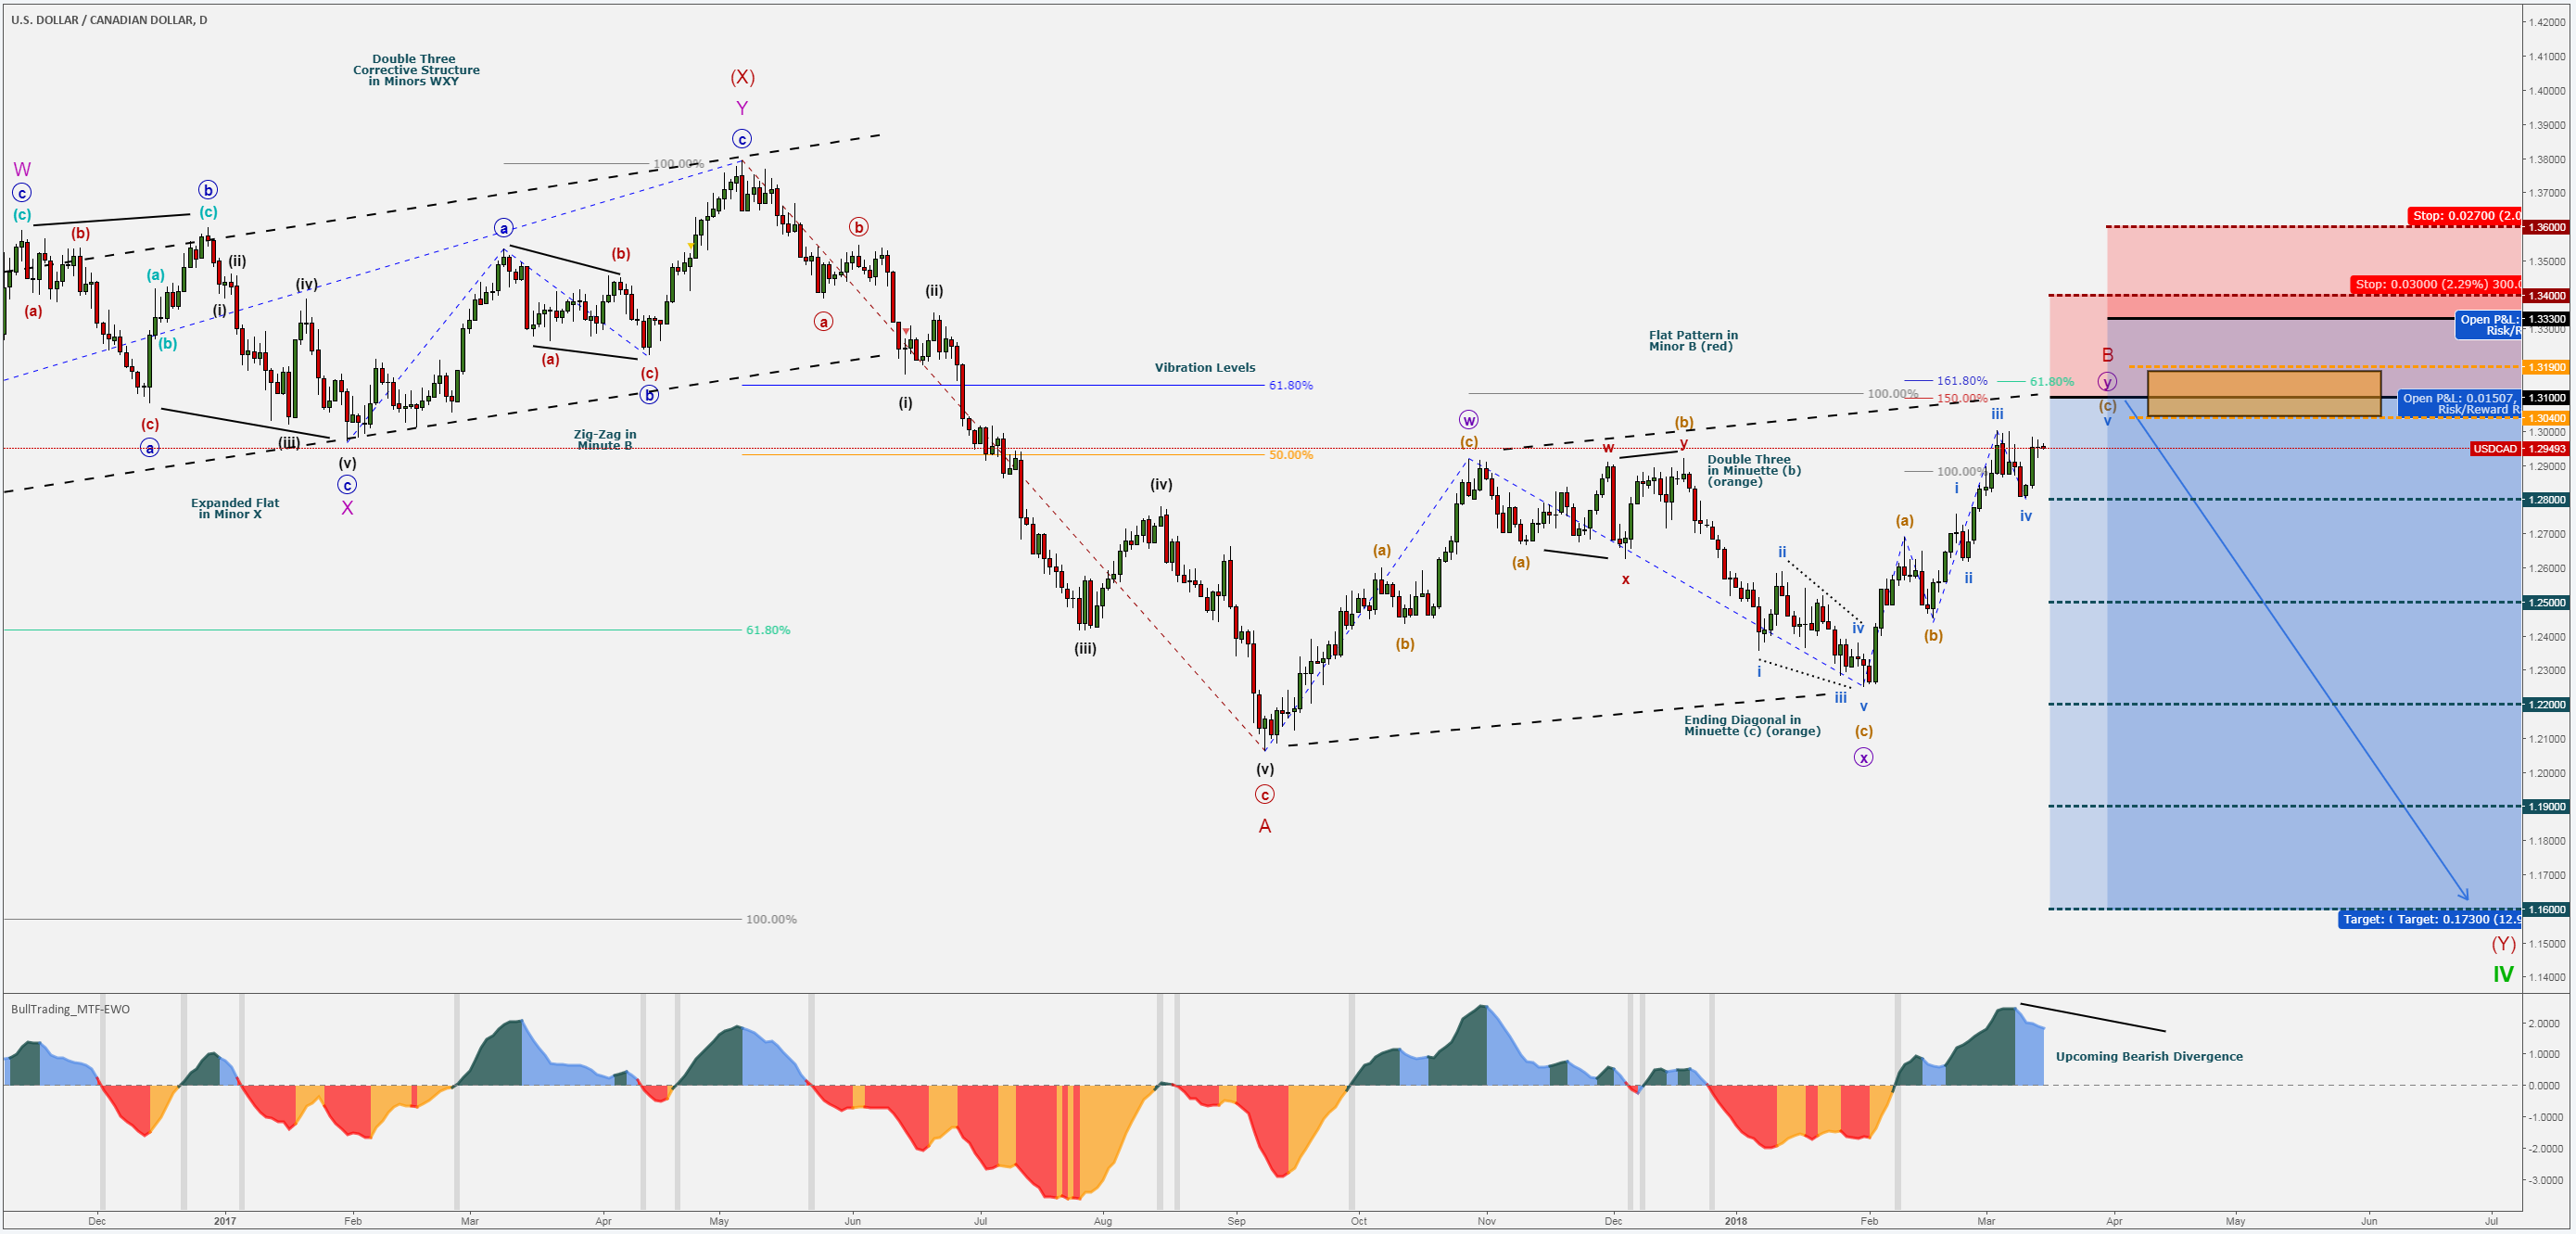
Minor A (red) finalized on 8th Sep 2017 and the Corrective Structure of Minor B (red) commenced, which is labeled as a Flat Pattern.
Minor B (red) Elliott Wave & Fibonacci Analysis:
- Flat Pattern is pointing towards the 61.8 Fibonacci Retracement of Minor A (red), which also coincides with the 100% Fibonacci Extensions of Minutes w & x (purple), but also with the 150-161.8% Fibonacci Extensions of Minuettes (a)&(b) (orange), projected levels of Minuette (c) (orange).
- For this scenario to be taken into consideration, the Fibonacci Levels would be accompanied by a Bearish Divergence.
Bearish Levels in focus:
- Moderate – 1.3100 with Invalidations @ 1.3400
- Conservative – 1.3330 with Invalidations @ 1.3600
Projected Levels – 1.2800 / 1.2500 / 1.2200 / 1.1900 / 1.1600
*The present analysis is to be treated as simple market commentary and not as an investment advice or as a solicitation to trade. Please be aware of the real risk involved by trading financial instruments.
Many pips ahead,
RT

![Credit Card 160×600 [EN]](https://assets.iorbex.com/blog/wp-content/uploads/2023/06/13144507/Blog-Banner_EN-Banner_160X600X2.webp)