The quarterly price candle on the Dow Jones Industrials Average (DJIA) is looking like a long-legged doji, one of the most striking signs of reversal in Japanese candlestick analysis. The fact that such rare candle formation is shaping up on the quarterly chart (not a daily or weekly) implies further downside in the subsequent three-six months, and possibly beyond.
There are 2 weeks remaining into the end of the quarter, which will fall on Thursday, March 29th. As the markets are closed on March 30th (for Good Friday) in order for the quarterly doji to remain valid, the close on March 29th must be within the 24850-24740 range.
Rarity
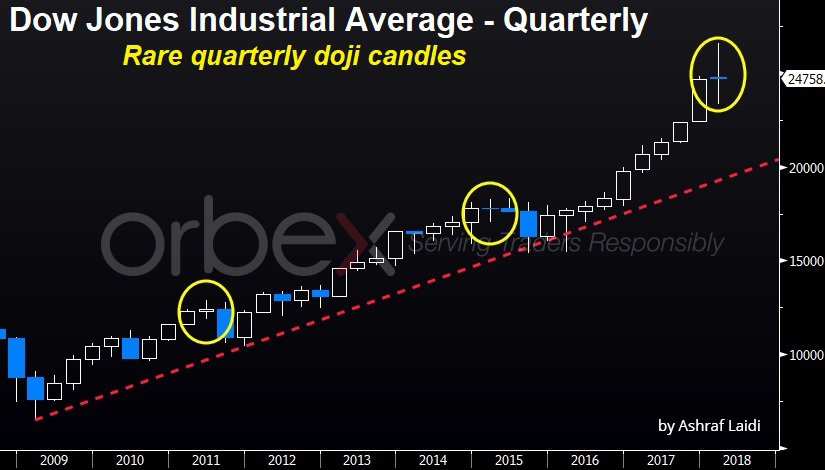

Although there has never been a bearish dow’s rare quarterly doji candle with legs as long as the one seen in the current quarter, the last twenty years have shown only two occasions of bearish doji candles with follow-through selling; in the first quarter of 2015; and in the second quarter of 2011. Both cases involved a candle with a body of no more than 120 points (difference between open and close).
- The Q2 2011 doji candle was followed by an 18% decline in the DJIA over the subsequent two quarters. The selling was driven by market fears about escalating sovereign debt in the Eurozone and the US losing its AAA sovereign credit rating.
- The Q1 2015 doji candle headed off two consecutive quarterly declines, totalling a 15% fall in the index. That period was highlighted by a bear market in commodities and fears of falling Chinese demand.
Now vs. then
Today’s economic and market environments contrast with those in the aforementioned two scenarios. On the positive side, commodities are in a bull market, China’s rising currency is helping to save off the risk of global deflation, while emerging markets are contributing to a more synchronized global growth.
The question remains whether central bank policy tightening can continue without damaging the fragile fabric of consumer debt and exacerbating the fiscal imbalances in the US and China.
Not to mention the rapid prolonged fluctuations in equity indices, which are in part a result of excessive volatility bets emerging in an era of easy money.
How Far Down?
Will the DJIA fall by 15%-18% in Q2-Q4, in similar fashion to 2011 and 2015? The technical similarities are here. A 15% decline from current levels would lead towards 21,000. A 19%-20% decline would take us towards 20,000, which falls right along the trendline support from the 2009 low—the longest and most relevant foundation support in global equity indices.

![Credit Card 160×600 [EN]](https://assets.iorbex.com/blog/wp-content/uploads/2023/06/13144507/Blog-Banner_EN-Banner_160X600X2.webp)