
The Ichimoku trading indicator is well known for its capability of offering a complete trading system. This has been well documented, and trend following traders rely upon the Ichimoku’s indicators. However, various strategies can be developed using the Ichimoku’s different components as well.
One might argue on the merits of picking apart the Ichimoku trading system when it offers a complete strategy in the first place. While this might be true, the fact remains that the trader has to assess different variables when trading with the Ichimoku system.
This might lead to the trader either being left on the sidelines while a strong trend is formed subsequently. The result of this being that traders tend to ignore the rules and this is where mistakes start to prove costly.
Beginners Guide To The Ichimoku Cloud

By using just one component of the Ichimoku system, traders can keep their trading system simple and rely on just a few signals to validate their bias.
In this Ichimoku trading system, we rely on the Chikou span or the lagging indicator. Anyone who has traded using the Ichimoku system will know that the lagging indicator is basically the closing prices, shifted 26 periods behind price.
One of the Ichimoku trading rules also dictates that one of the scenarios to ascertain a bullish or a bearish trend is to compare the current price against price 26 periods ago.
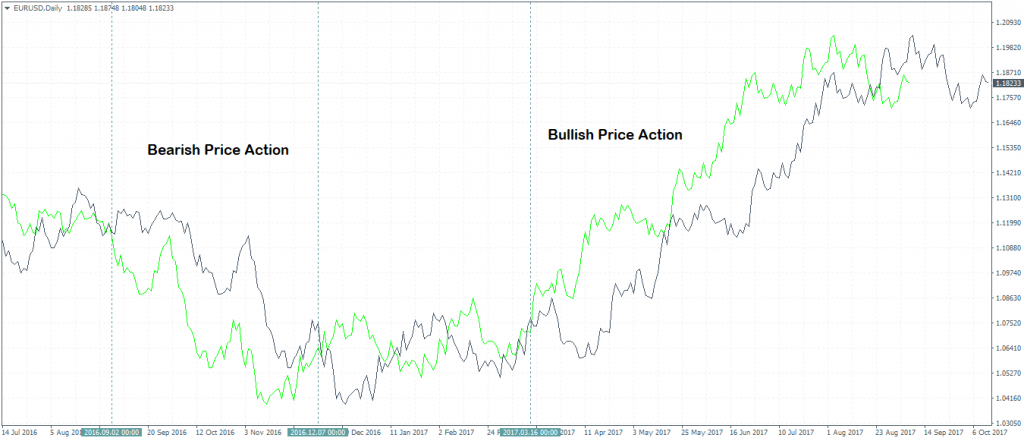
Thus, when the Chikou span is above price, the market is said to be bearish, and when the Chikou span is below price, the market is said to be bullish. The logic is quite simple. A bullish trend emerges when the current price is above the price 26 periods ago and vice versa. We can, however, look at the Chikou span differently by comparing it to the price line itself.
Identifying Trends with Ichimoku Cloud Indicator [Webinar]
In the first chart below, this concept is shown. The green line shows the Chikou span and the black line shows the price.
Trading with Chikou span and Awesome Oscillator
Combining the information with the Chikou span and the awesome oscillator creates a unique trading strategy. This method is not just simple but also allows traders quick reaction times to enter into a trend. The trading system is open-ended, meaning that traders can either continue to hold on to their positions until the trend starts to change, or traders can look towards booking profits at regular intervals.
The next chart below shows the set up that is quite simple. On the price chart, the Chikou span is overlaid while the Awesome oscillator sits in the sub-window.
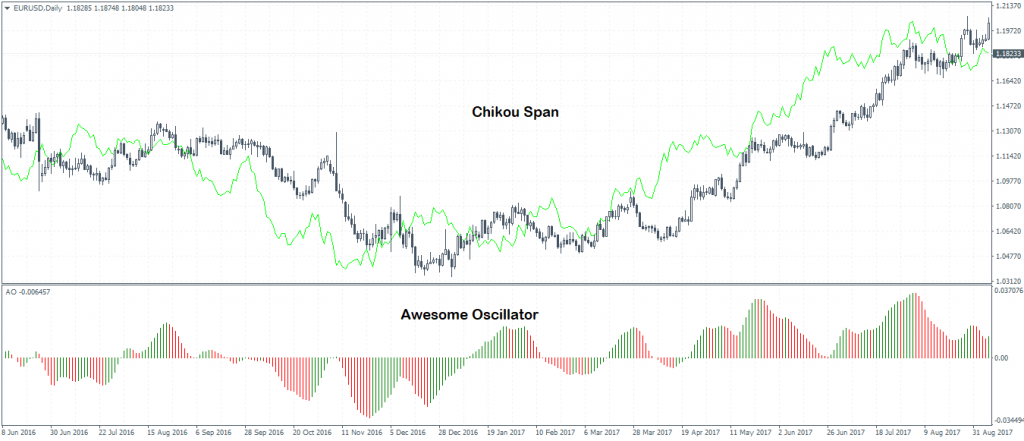
The trading rules are quite simple.
- A bearish market is when the Chikou span cuts below the price line
- A bullish market is when the Chikou span cuts above the price line
- The AO also signals bullish market when it crosses above the zero-line
- The AO signals bearish market when it crosses below the zero-line
When you combine both these indicators and they are in-sync suggesting a bullish or a bearish market, traders can comfortably take long or short positions respectively.
Trading examples using the Chikou span and AO indicator
In the first example, we can see a bearish market signal in price. In the next chart, you can see that the Chikou span signaled a bearish market by crossing below the price line. The price candle marked by the arrow, signals when this occurs.
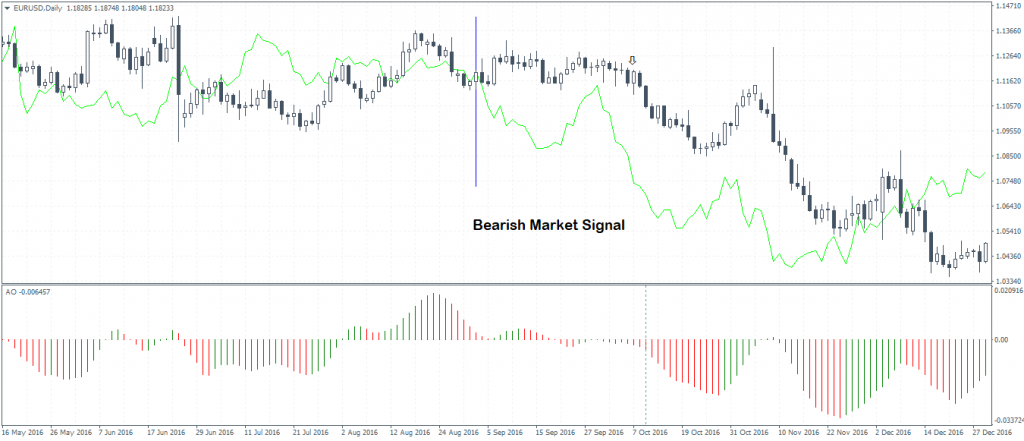
At the same time, we can also see that the AO is below the zero-line. Thus, both the indicators point to the decline in prices. Traders can set their stops at the recent swing high positions and based on this set the rewards of 1:2 and so on.
In the next example, we can see the bullish market signal in action.
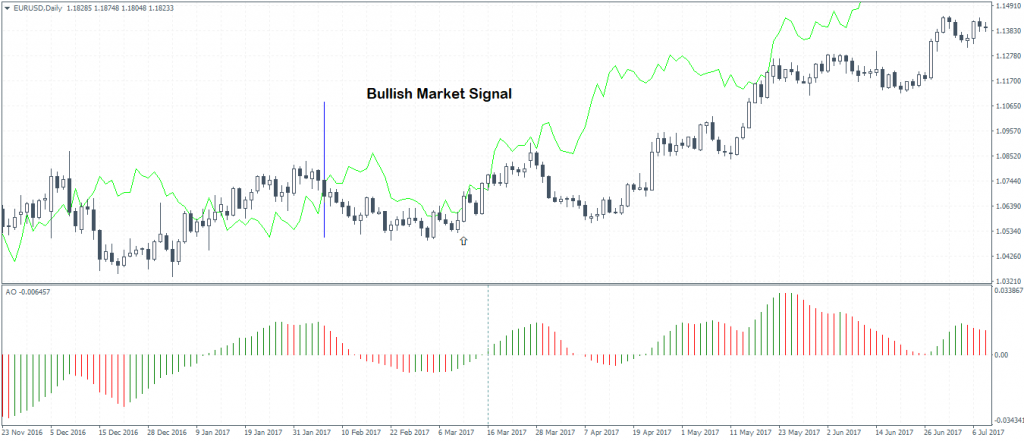
In this example, we can see that the Chikou span crosses above the price line. The AO also signals the same information with the crossover above the zero-line. Thus, long positions are taken here with stops set to the recent pivot lows.
The above-mentioned strategy works best on the daily time frame but could be applied to the H4 chart as well. This trend following method requires some patience, meaning that traders will have to stay on the sidelines for a few days at a stretch.
However, since all other variables are cut off, the simplicity of this trading strategy will enable you to enter early into a trend. The risks are relatively small compared to the rewards that come out of this trading system.

