
In the previous article, we covered the basics of the Rate of Change (ROC) indicator. We know that the Price ROC is merely an oscillator that measures the rate of change in price. Thus, we can conclude that the PROC indicator allows traders to gauge the momentum in price.
Be cautioned that the rate of change can be positive or negative. A positive ROC means that the rate of change is strong and to the upside. A negative ROC reading means that the price rate of change is strongly negative and shows that the decline in prices will continue.
Given that the previous article has laid the groundwork for how the price rate of change indicator works, in this article we take it to the next step and introduce some simple strategies that you can use with the PROC indicator.
In this particular strategy, we focus on trading the breakouts. Given that fact that markets tend to move sideways more than in a trend, breakout trading can help you to either enter in the direction of the trend or to merely scalp the markets for a few pips.

However, traders should not mistake this for a purely mechanical trading system as some discretion and market context needs to be considered.
Use momentum to trade breakouts
Trading breakouts can be risky, but when done correctly, breakout trading can yield good results. Breakouts can be qualified based on the momentum with which price breaks a certain support or resistance levels.
Thus the ROC is an ideal gauge to measure this momentum. After all, the indicator measures the rate of change in price. In most cases, strong momentum signals that the price direction will be maintained (at least for some time). This allows the trader to better manage their positions and trade accordingly.
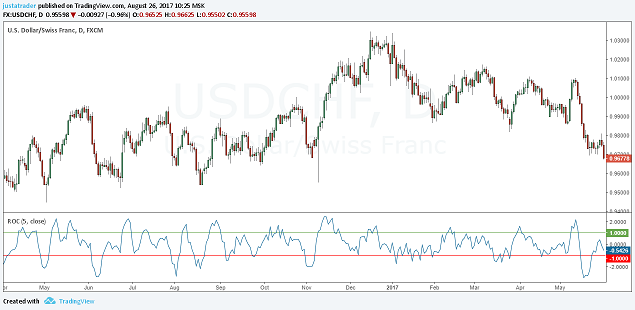
For the ROC, a 5-period is used. This is not a “magic number, ” and one should explore the different settings. In this example, we use 5 period ROC on a daily chart as it represents the momentum in price over the past 5 days.
We also remove the zero-line and instead plot the levels of +1 and -1. When the ROC rises above +1 the momentum is strongest, and vice versa when the ROC dips below -1. You can also change these values depending on the volatility of the currency pair that you are analyzing. So, you can also use +/- 0.5 or +/- 0.25.
Once the ROC settings are applied, and the appropriate levels are drawn on the oscillator, your chart should look like the one below. Simple and clean!
Once your chart is set up, the next step is to identify the range. In order to plot the range, you need to look at the market context. For example, is the range high that you plot actually a past support level that could become resistance? What is the current trend in the market?
Asking these questions will help you to plot the ranges in a more reliable manner.
Once you determine the ranges, the next step is to wait for a breakout or to be more specific a session close above or below the range high or low. You can then determine the rate of change (whether it is positive or negative) and apply this knowledge to the direction of the breakout.
Simply put, when there is an upside breakout, the ROC should be above +1, indicating strong upside momentum. Likewise, in a downside breakout, the ROC should be below -1 indicating strong downside momentum.
The next chart shows an example of a downside breakout. (Yes, it took a while for the breakout to occur with price breaking out from the range only in early June, nearly four months after the range was first established).
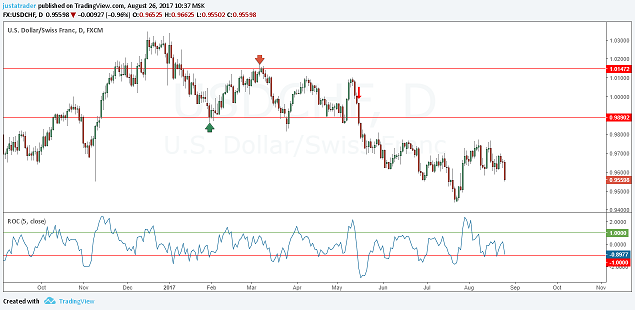
In this example, you can see that after USDCHF broke below the range low of 0.9890, the ROC reading for -2. Thus we can comfortably take a short position here at the low of the session close with stops at the high.
The risk reward can be set up to 1:2 to begin with and with proper position management you can also split your trades so as to book partial profits at regular intervals in order to maximize the trade.
How to know when to stay away from trading breakouts?
In the next example of the ROC breakout, we look at the NZDUSD intraday chart. Notice here that the ROC value is set to 6 (measuring the rate of change over the past 6-hours). The ROC levels of + and – 1 are also too far off, so we change this to +/- 0.5.
In this example, there are some important points to note on how not to trade the breakout with the ROC.
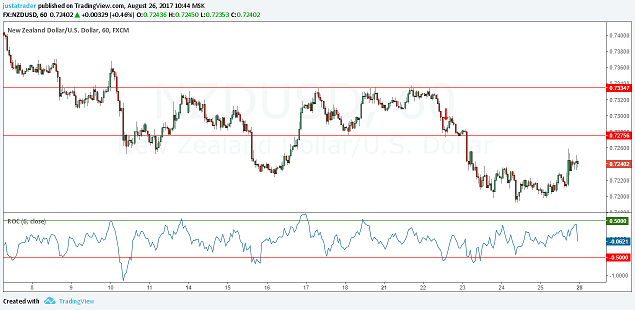
Firstly, notice the fake breakout. Here, price pierced the lower range with the ROC below -0.5 but price closed back above the lower range. This would have trapped early traders who preferred to go short here.
A few sessions later, we have a strong bearish candle breaking out of this range. In this scenario, the ROC was still above -0.5, suggesting that it would be a risky trade to make. As obvious, a 1:2 trade set up would not have materialized. At best you would have been lucky if you booked some profits before the first target was hit.
Getting better with breakouts and ROC
With enough practice and familiarity of the system, traders can efficiently build a successful breakout trading strategy using the ROC indicator. The benefits of this method are quite obvious. When you pick the right set up, your risk/reward is automatically high, and with some good money and trade management skills you can maximize the returns from just one single trade.
Even if the trade reverses back, you can efficiently manage your stops in order to limit your losses.

![Credit Card 160×600 [EN]](https://assets.iorbex.com/blog/wp-content/uploads/2023/06/13144507/Blog-Banner_EN-Banner_160X600X2.webp)