
Another week has passed, and the US Dollar continues to lose ground, despite the fact that there were some positive economic releases at the end of the week.
Yet, the US Dollar Index tumbled to the lowest level since June of last year and closed the week around 93.25, nearing 93.0 key support area.
Fundamental Catalyst
One of the main reasons behind the previous week’s decline is the Federal Reserve’s latest statement. The Federal Reserve decided to keep the current policy unchanged as widely expected.

However, what matters the most is that the Fed decided to replace the sentence regarding trimming its balance sheet later this year and decided to replace it with “trimming the balance sheet relatively soon.”
This gave the market a clear sign that the Fed has doubts about trimming its balance sheet this year, and might rethink it later next year. Such remarks mean that the accommodative policy is here to stay.
No Buying Interest Anytime Soon
Looking at the latest commitment of traders report by the CFTC, we can see that traders are still betting on further declines ahead.
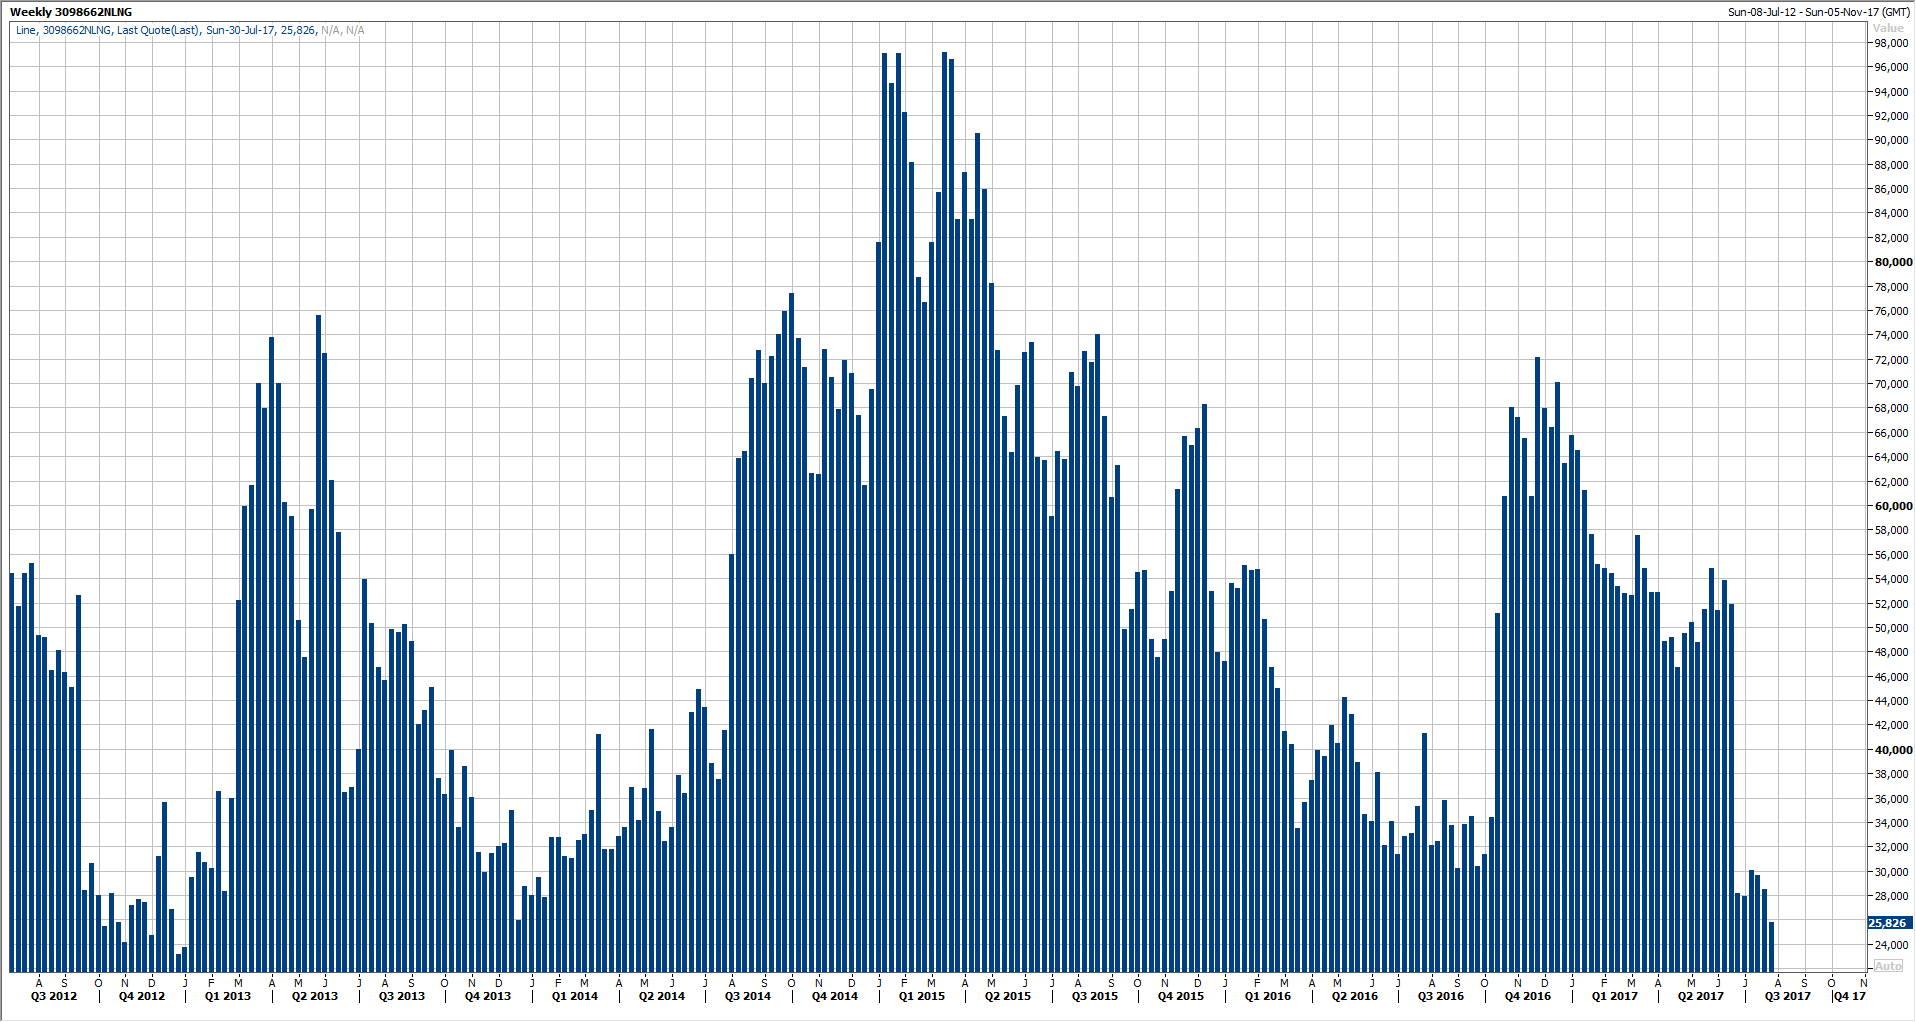
The latest Non-Commercial Longs data showed a notable decline back to 25K, which is the lowest level since 2011, declining by more than 63% since the beginning of this year.
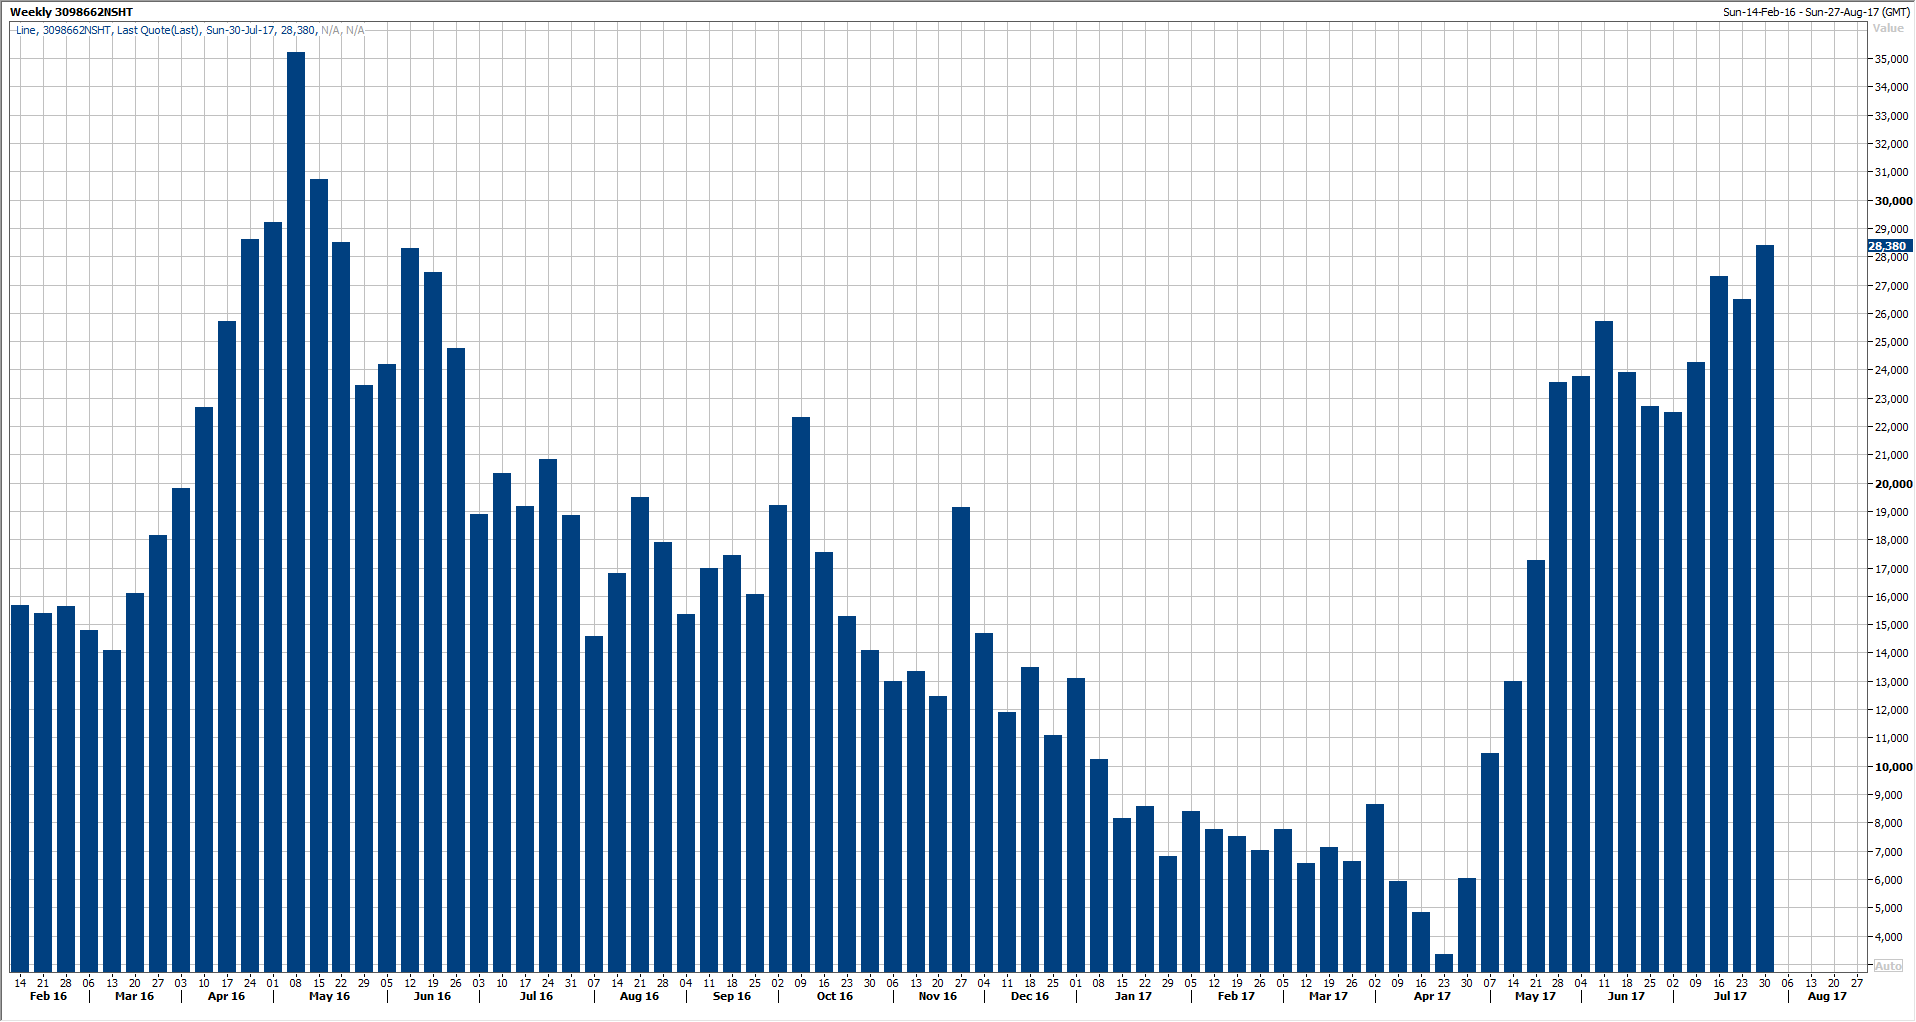
At the same time, the Non-Commercial shorts are rising since April of this year until today, reaching the highest level since May of 2016, rising by more than 110.5% since the beginning of the year.
Eyes on This Week’s Data
In the next few days, traders are advised to keep an eye on the upcoming economic releases from the US.
Today, eyes will be on Chicago PMI and Pending Home Sales. Tuesday would be one of the most important days this week as we wait for the Personal Spending, Personal Income and most importantly the Core PCE Price Index, which is the Federal Reserve’s favorite inflation index.
At the end of the week, on Friday, we will be watching the US Jobs Report, which should have the biggest impact on the markets, as it would give us more clues on whether the US economy is expanding, or if it’s indeed slowing down.
Another wave of disappointing data would send another hint to the market, that the Federal Reserve might not be able to trim its balance sheet and/or to raise rates later this year.
Keep an Eye on USD Index Technical Support
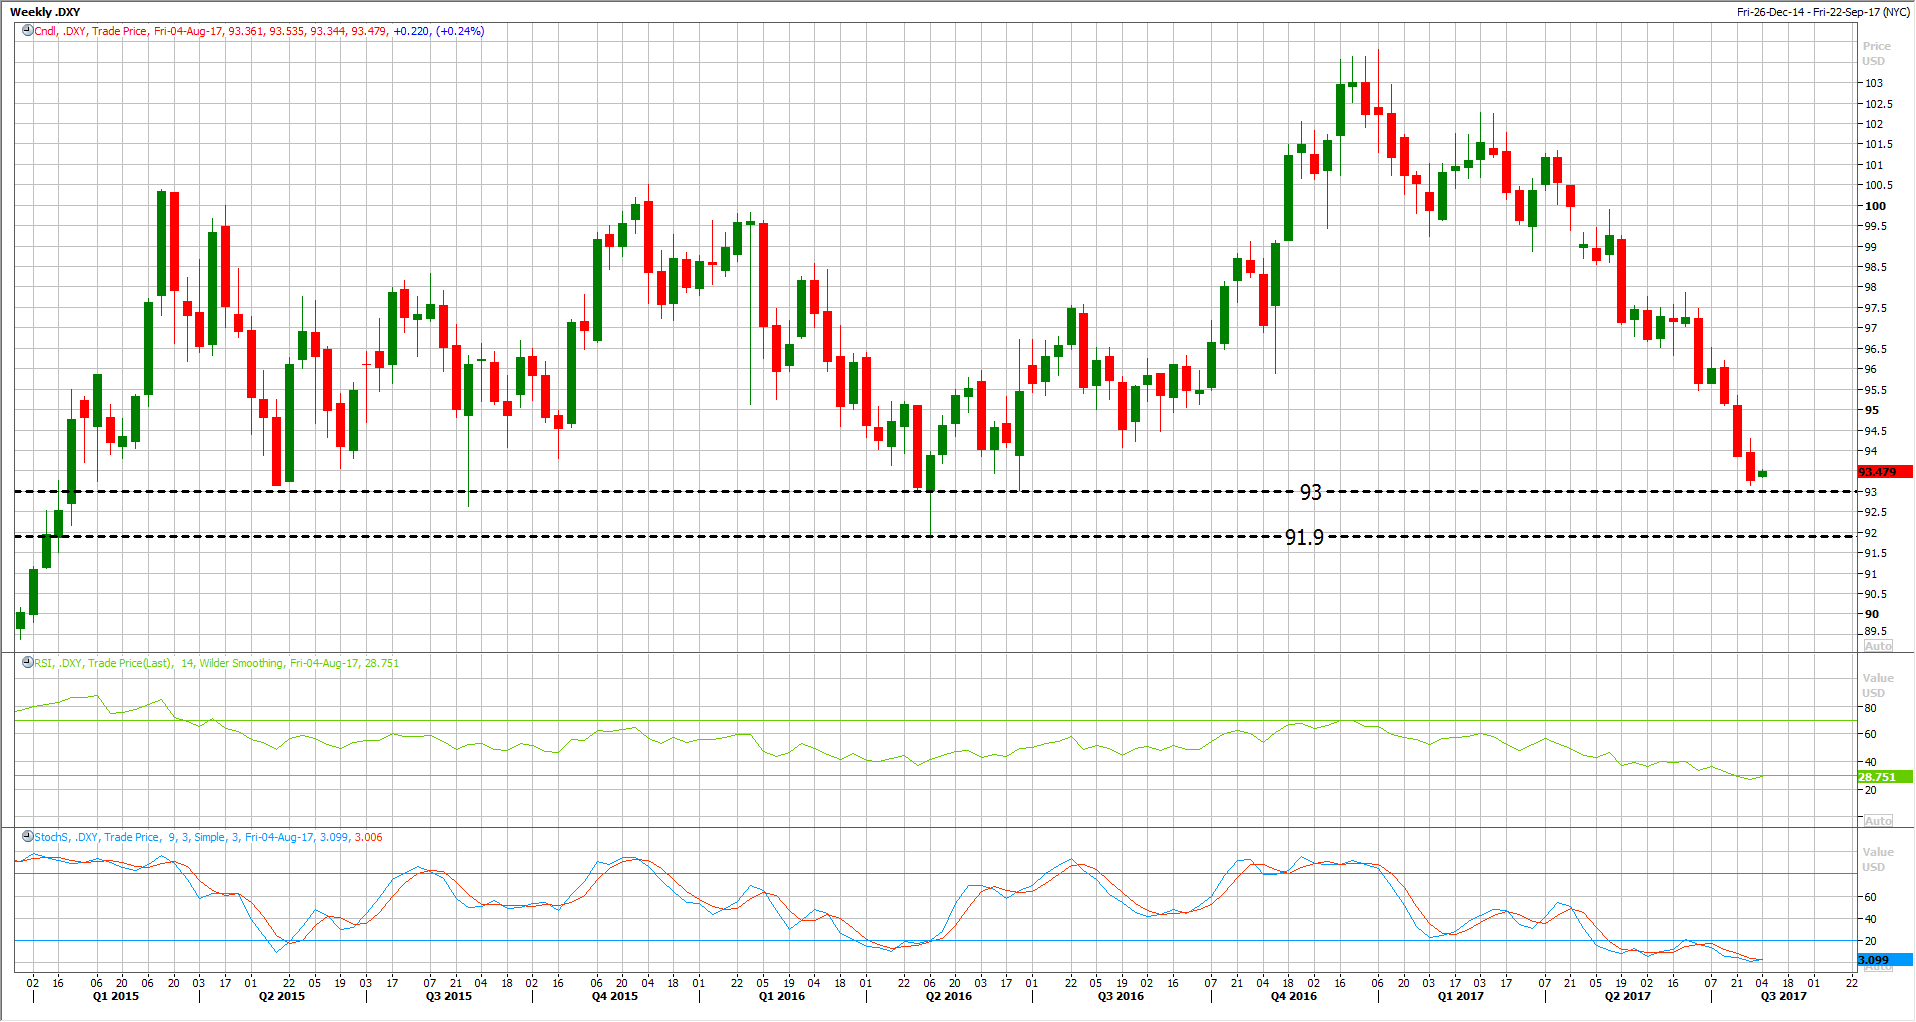
The US Dollar Index is about to complete the longest declining stake since 2011. The US Dollar has been declining for the past consecutive months, which is something that we have not seen since 2011, which deepen the bearish outlook.
However, traders are advised not to rush into shorting the US Dollar now, as it’s already down by more than 9% this year. Moreover, the technical indicators are heavily oversold, which means that a technical retracement is needed before the down trend resumes.
The most important area that traders need to keep an eye on stands between 93.0 and 91.90’s. This area represents a long term support on the weekly chart, which lasted and supported the index since January of 2015.
Therefore, a breakthrough that support is unlikely to be easy, and a short-term retracement is highly possible from such area.
At the same time, any upside retracement is likely to be limited below 95/96 area. Only a breakthrough the 91.9 with a weekly close below that support would clear the way for further and faster declines ahead, probably toward 90.0 psychological support.

