A week ago, both metals were sinking, Gold almost tested $1200, while Silver crashed to $14 before recovering quickly above $15 the next day.
Today, Gold is trading around $1240, while Silver is stabilizing well above $16 so far, which might be a sign for another move ahead.
Higher Gold On Low Inflation?
Some traders are confused with the recent rally in Gold. The main question that we are getting is, how and why Gold is rallying despite the fact that inflation has declined back?

The question is true, usually, when inflation goes up, investors would hedge against higher inflation through buying Gold. But this time things are different.
For the past few weeks, Gold was declining as Central Banks sent a clear message to the market that the era of easy monetary policies is coming to an end sooner rather than later.
This pushed the global bond yields higher. Investors rushed into fixed income assets, as yields climbed to 2.4% in the US.
This was the case until the Friday of last week when the economic releases in the US showed a notable deterioration in inflation, which is a clear sign for the markets that the Fed is likely to hold off on raising rates in September.
Yields reached lower, the 10 Year Yield is now at 2.28%, pushing Gold and Silver higher once again, as the market is uncertain regarding
Demand Remains On The Upside
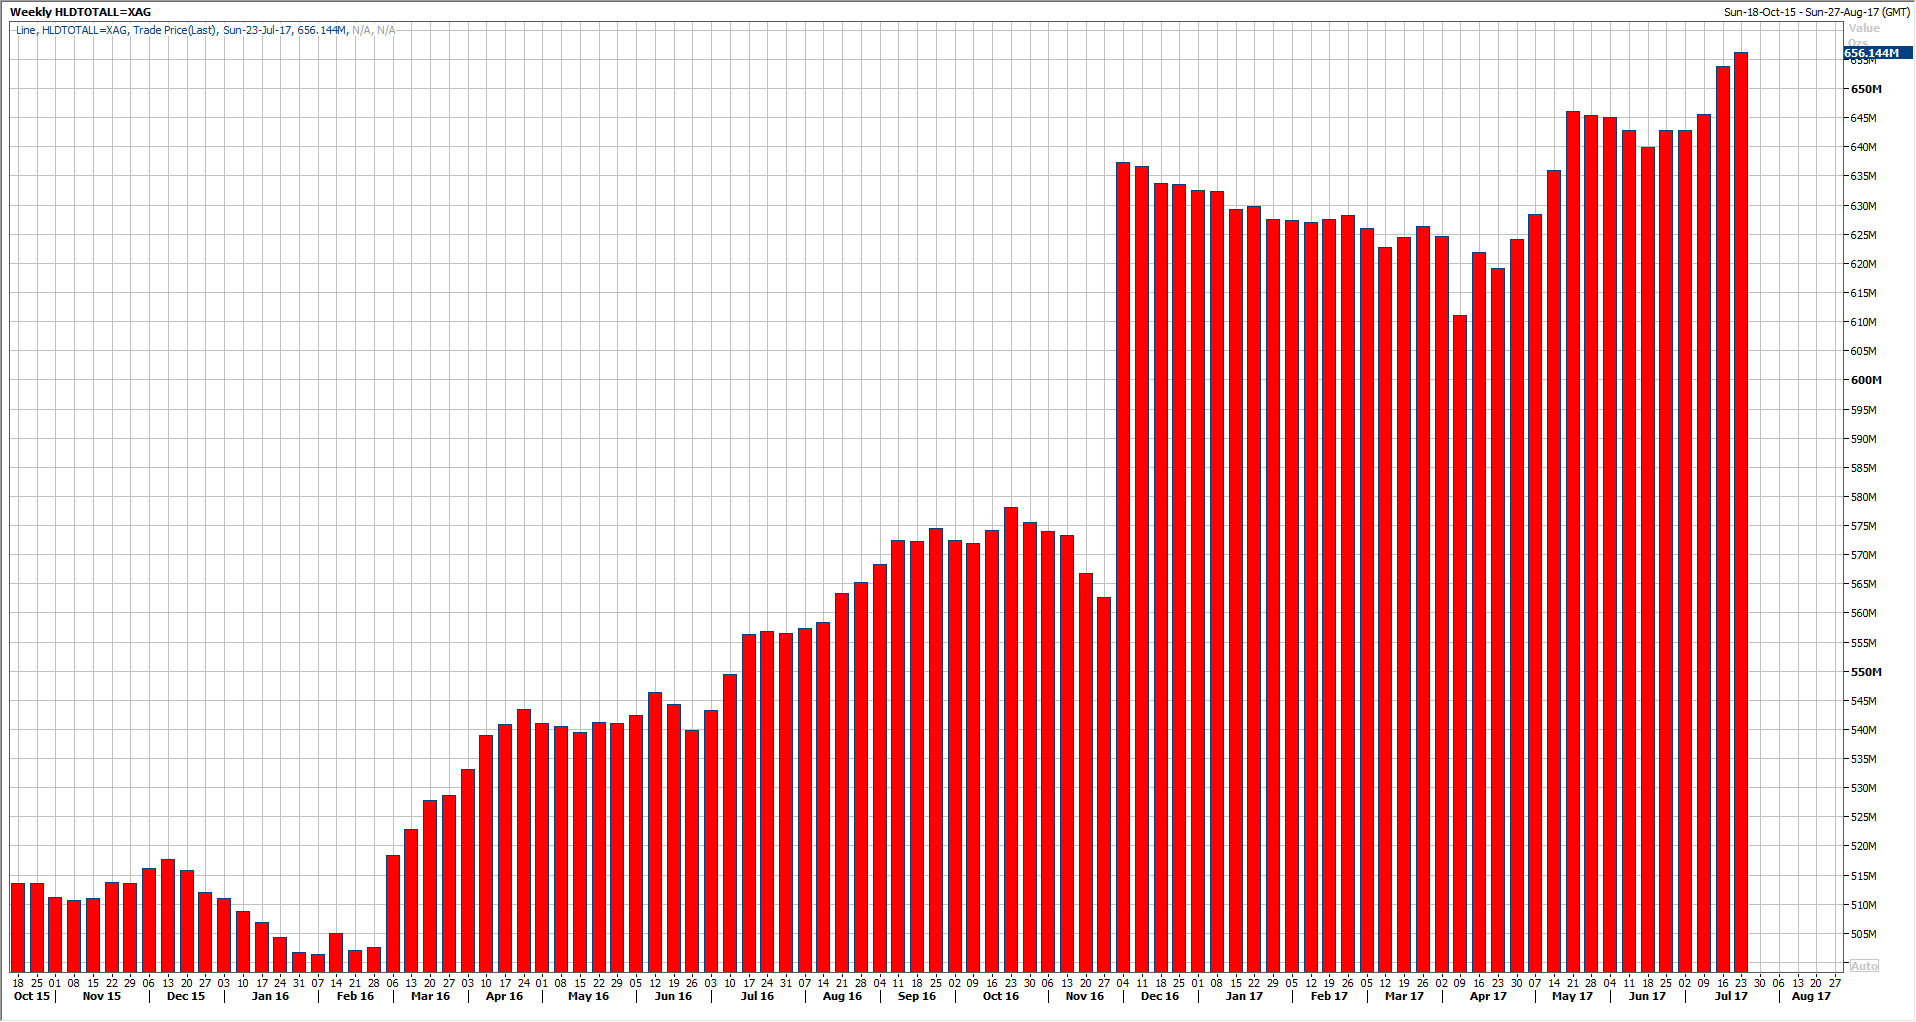
Despite the recent flash crash in Silver, it looks like the demand remains on the upside. If we take a look at the last known physical ETF holdings of Silver, we can clearly spot that it jumped to record high last week.
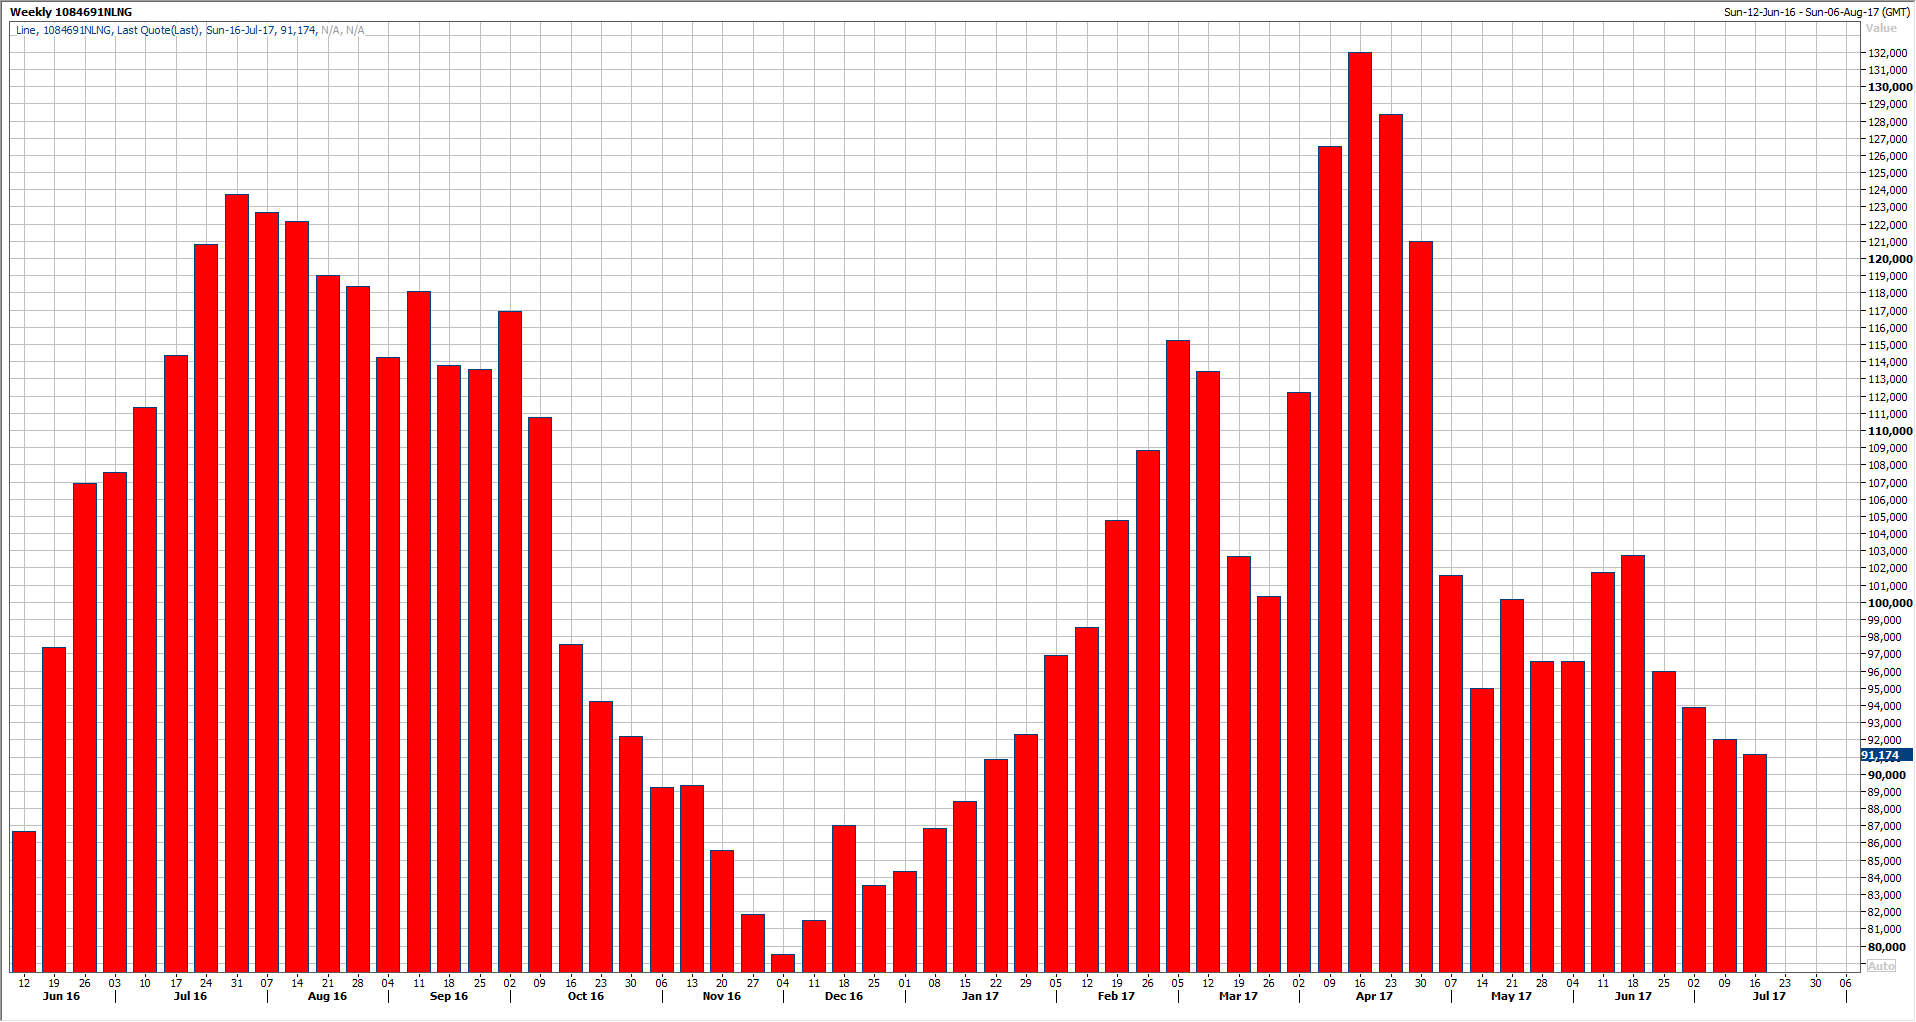
However, if you take a look at the COT report by the CFTC, we can see that the non-commercial longs declined for the past three weeks. Yet, this doesn’t mean that traders are wrong, but keep an eye on this week’s COT, things might actually change
Gold Technical Outlook
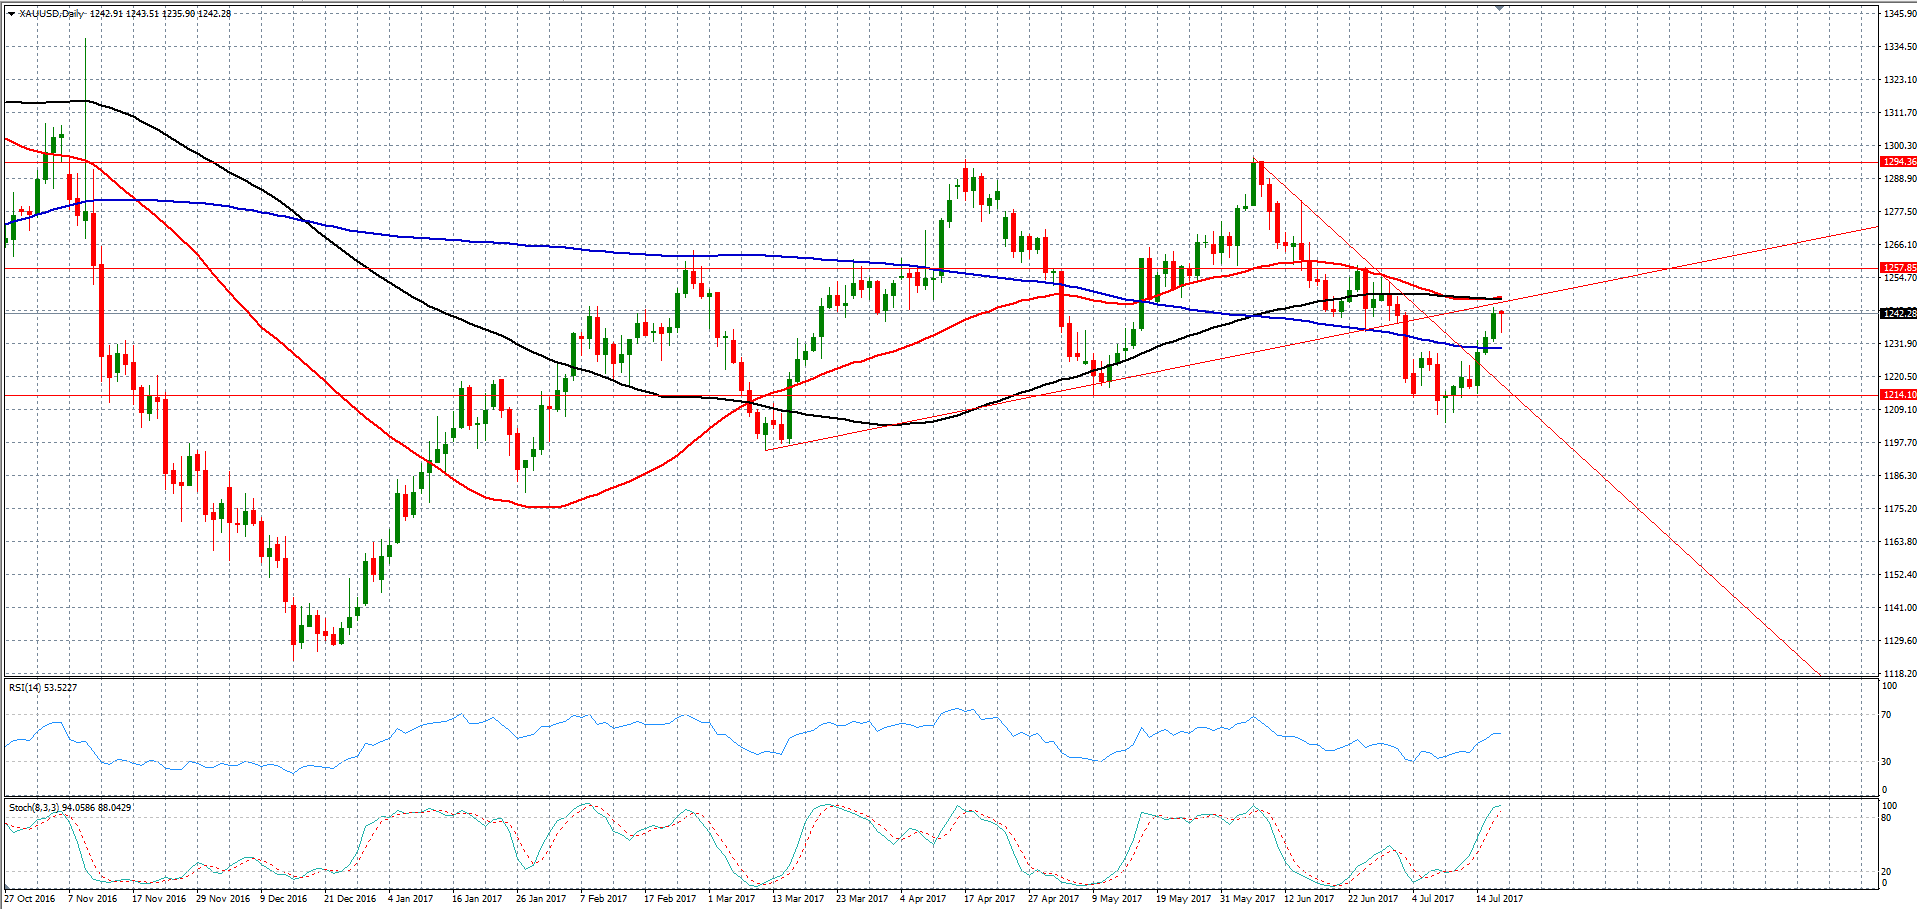
Despite the fact that Gold broke the rules of the higher lows pattern which lasted since the beginning of the year, it managed to bounce right from the same support area, which stands at 1210.
So far, Gold added around $30 from the recent decline, which actually proves Gold’s potential until the end of this year.
In the meantime, the downside retracement is likely to remain limited above $1200 barrier. But on the upside view, Gold needs to break above its 50 and 100 DAY MA, after it managed to break above the 200 DAY MA earlier this week. A break of which would renew the strong bullish outlook.
Silver Technical Outlook
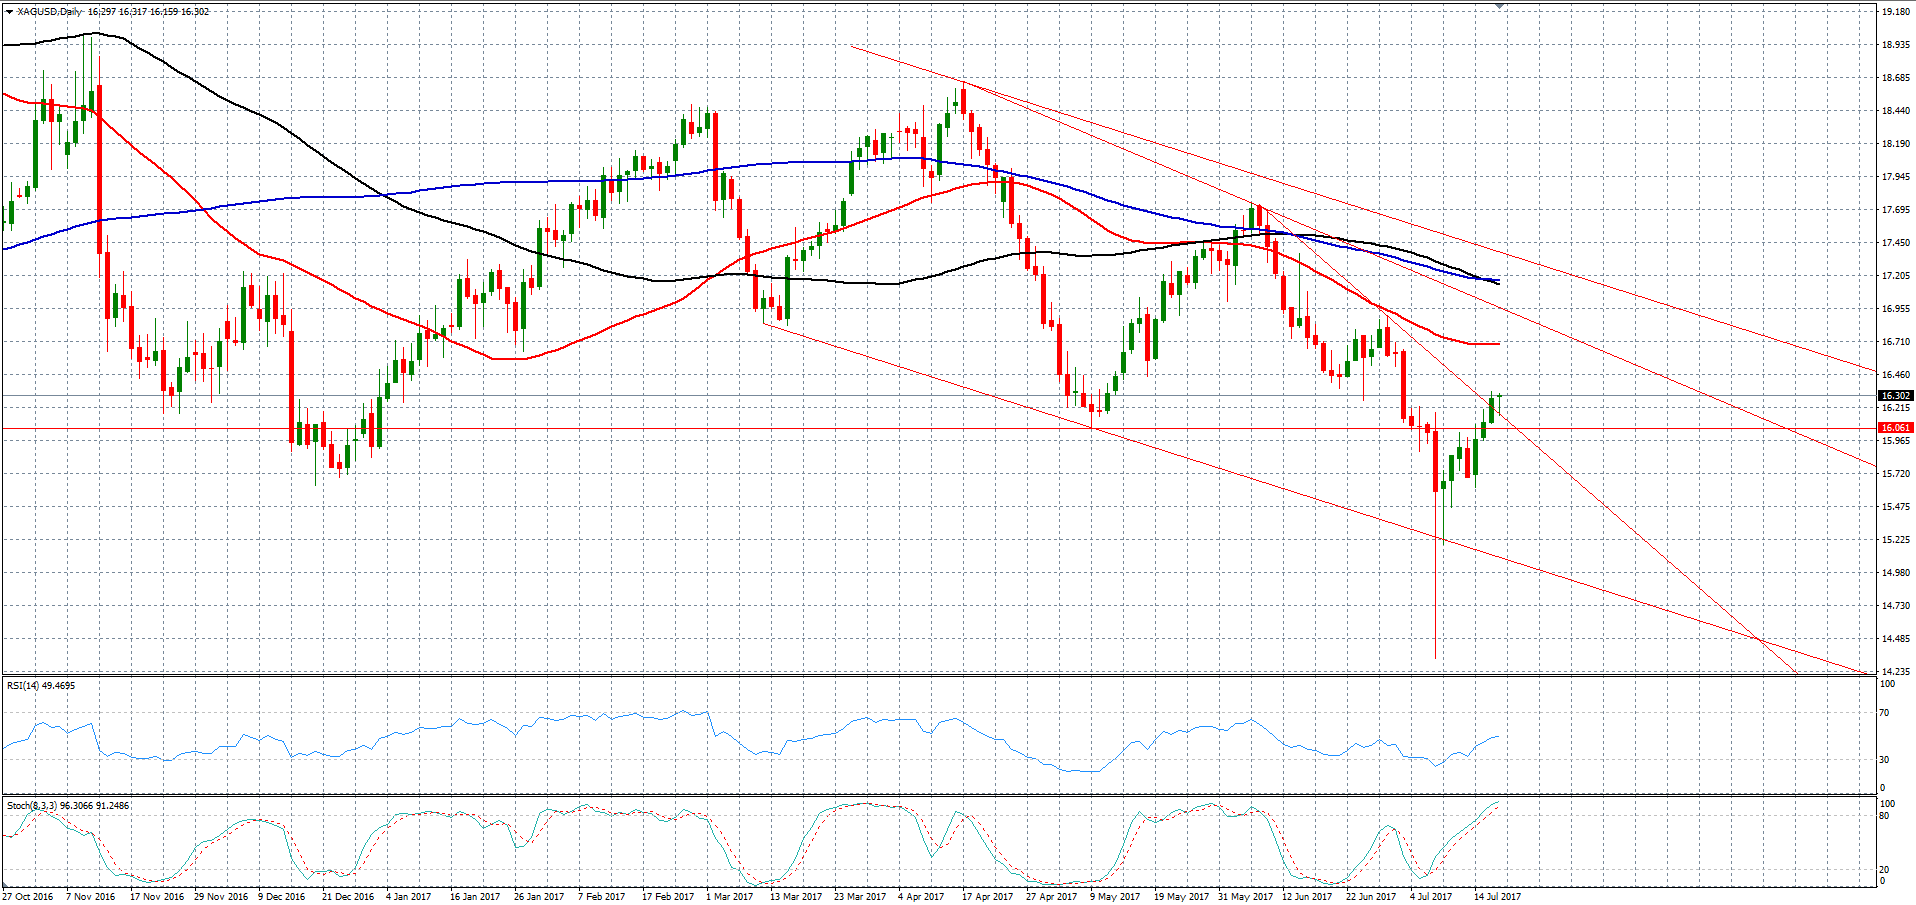
Silver is now trading above $16 since the beginning of the week with a clear signs of stabilization, which keeps the current optimistic momentum.
Yet, Silver still need to prove it self by breaking above its entire moving averages, including the 50, 100 and 200 DAY MA, which stands at 16.65, 17.18 and 17.25 respectively.
Until then, we will keep a close eye on Silver’s momentum. On the downside view, the retracement might be limited above the recent lows, either $16 and/or $15.50 but shouldn’t be more. A break below those two levels would renew the downside outlook.
On the upside view, on the short term, the next immediate resistance area stands at 16.40, followed by the 50 DAY MA at 16.65.
We need at least a weekly close above those levels to keep the estimates higher for a possible breakout during the next few weeks.
Otherwise, the risk for another leg lower is here to stay.

![Credit Card 160×600 [EN]](https://assets.iorbex.com/blog/wp-content/uploads/2023/06/13144507/Blog-Banner_EN-Banner_160X600X2.webp)