Day trading is a game of probabilities.
A trade setup that has a higher probability is no doubt preferred. There are immense benefits to objectively analyze your technical setups. For one, your risks are limited and give you a very clear logical view of what is going to happen.
If you are stopped out, you can accept the losses and move on without giving any room for emotions to step in. In most cases, assigning a probability also means that you can weigh your risk and reward beforehand. The question that comes to mind is how to recognize a trade that has a higher probability or chance of winning.
There are many ways to do this. For one, you can make a thorough analysis of your trading strategy by back testing or even forward testing. This will help to ensure that you remain objective, no matter what. Another way is to look at, at least two separate events that can signal the same bias.

Take for example the moving average crossover. Not every bullish and bearish moving average crossover is successful. This is because there is just one event in play, which is the crossover. So how can you trade the moving average crossover with higher success? Simply add another indicator that gives a completely different perspective of the market.
The 3 Bar Counter Trend Strategy
This could be support and resistance breakouts, or even divergences that can validate or invalidate the initial signal.
In this article, we look at one such example where a trader can increase the probability of a trading setup.
How to improve the trend line breakout strategy
I won’t go into much details on how to plot a trend line. If you are reading this article, chances are that you already have experience in plotting trend lines.
One of the most common issues facing breakout trading methods is the fakeout.
A fakeout occurs when price tricks you into a false breakout, only to capture your trade and move (usually) in the opposite direction and with renewed momentum. Some might even call this a stop hunting technique.
This is frequently seen even with trend lines and not just horizontal breakouts or candlestick breakouts.
To reduce the chances of being caught in such fakeouts, the first step is to plot the trendline of course. Once you do that, we know that long or short positions can be taken when price breaks the (rising or falling) trend line.
Here’s the first chart illustrating this point.
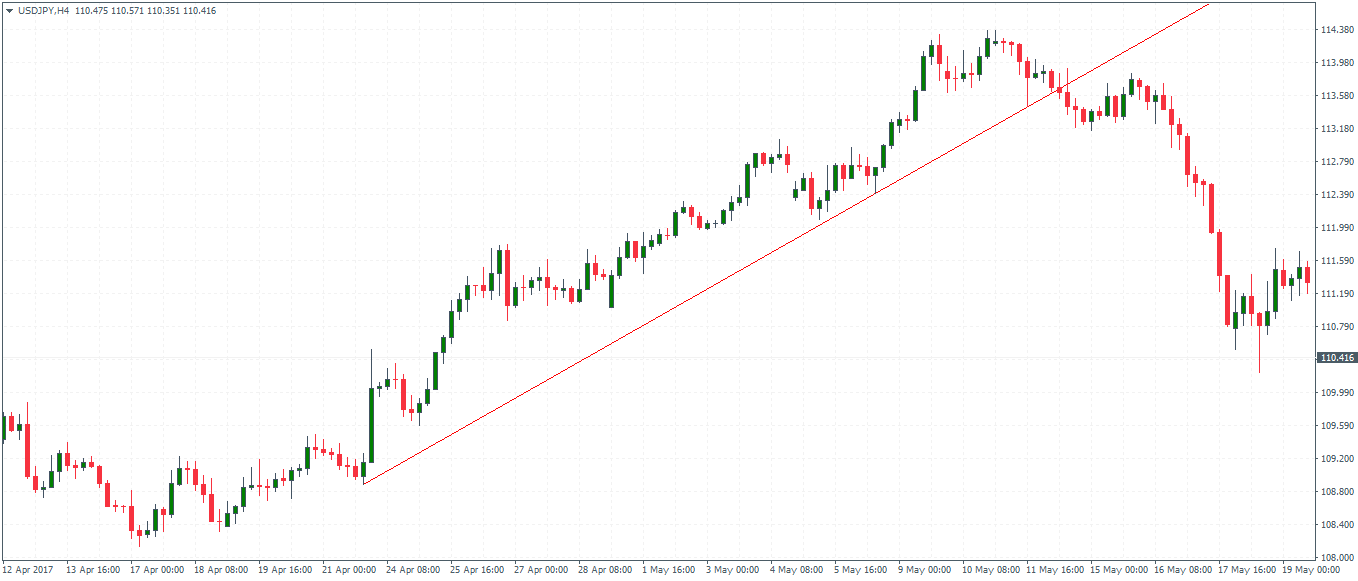
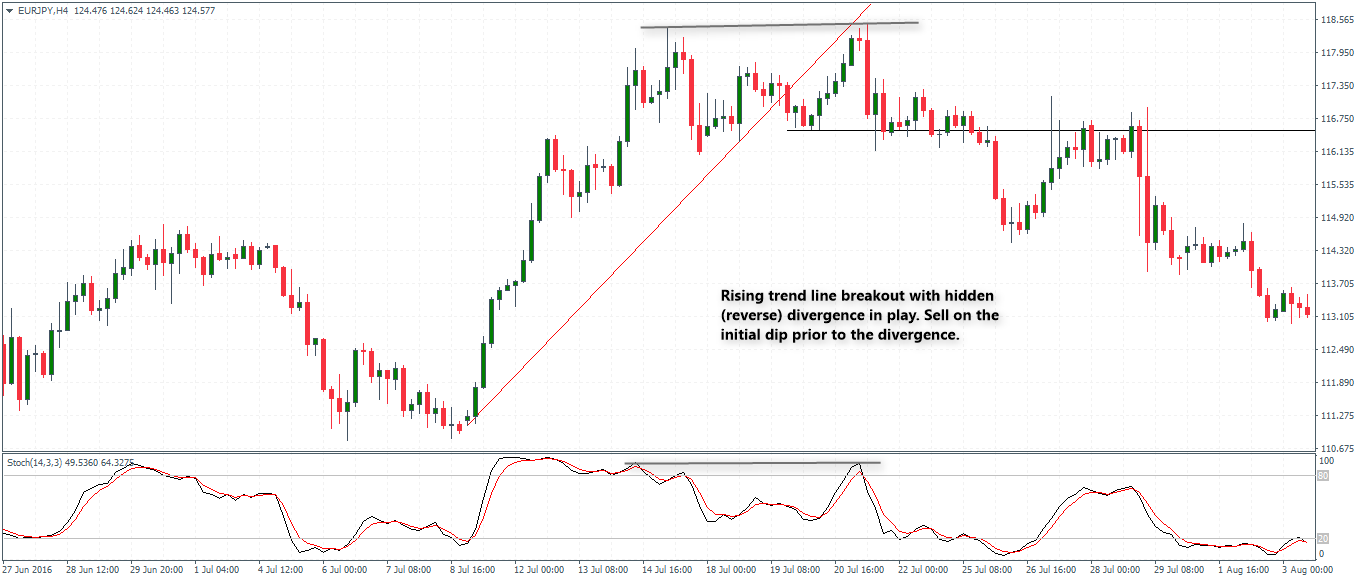
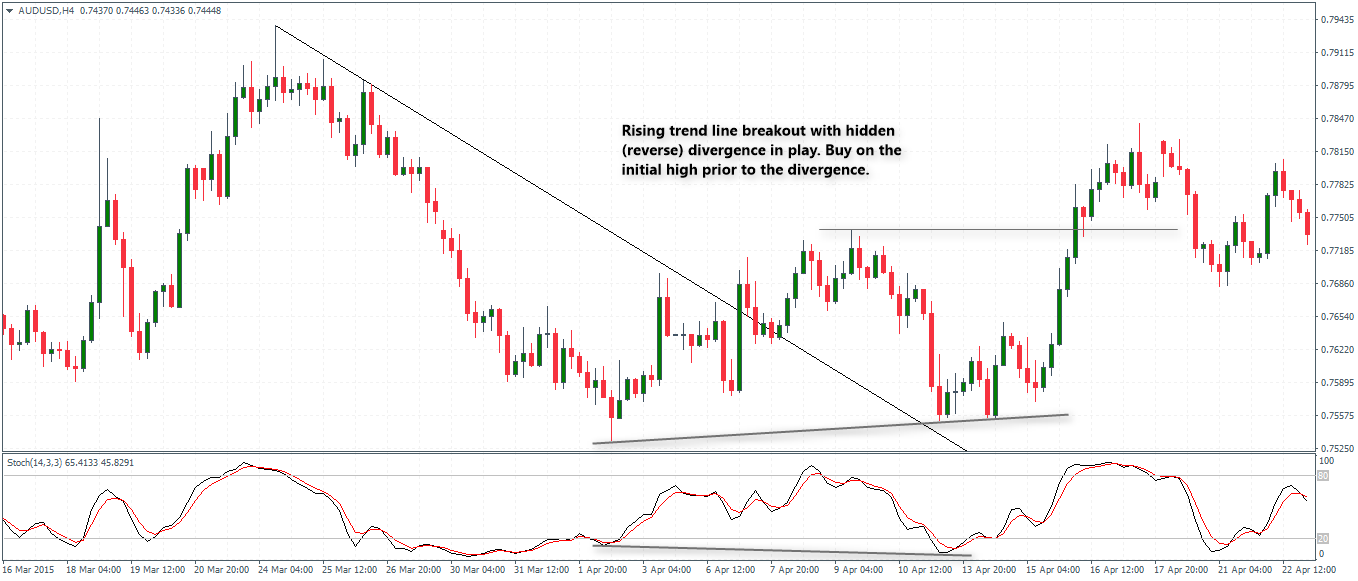
In Figure 1, we have a classic breakout from the rising trendline. This is quite straightforward. You sell on the breakout and price, fortunately, did not move back higher. Now the next chart shows what can also happen with trendline breakouts.
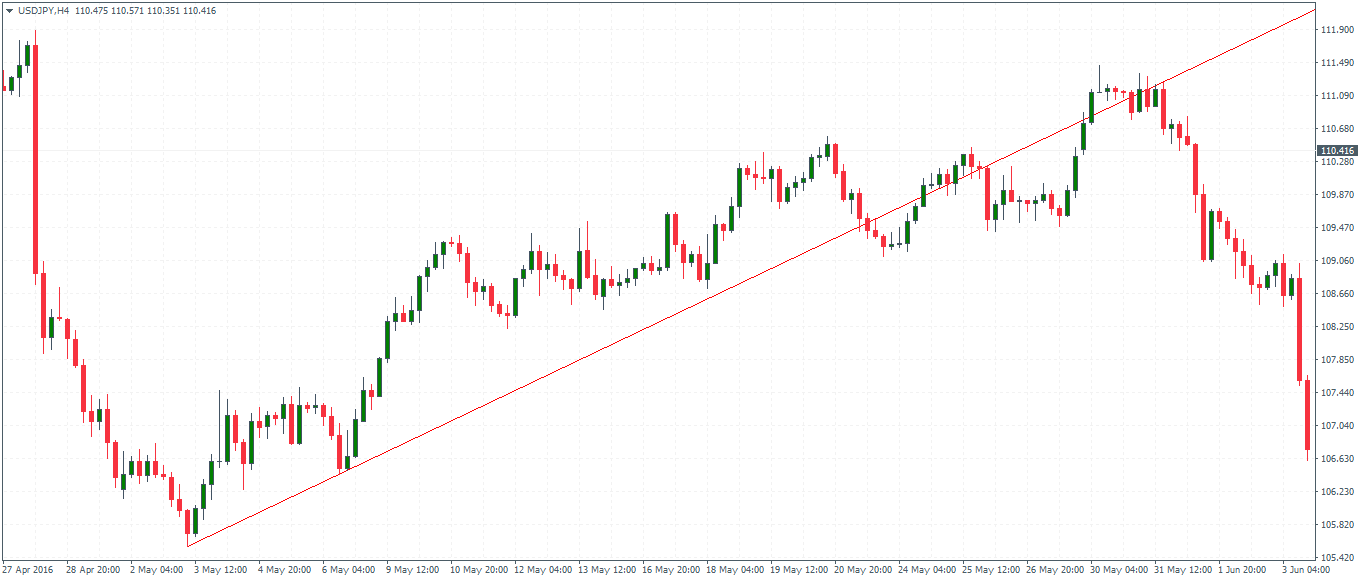
In Figure 2, after plotting the trend line, we notice not once but two instances of a fake breakout. Price slips lower, only to move back higher. Then, a lower high is formed which gives the impression of a correction that is about to happen. Unfortunately, even in the second attempt, the price makes a fake downside breakout before rallying higher.
The final breakout did indeed push price lower, but by this point, most traders would have given up on this setup.
So how can we stay more alert and avoid these potential fake breakouts?
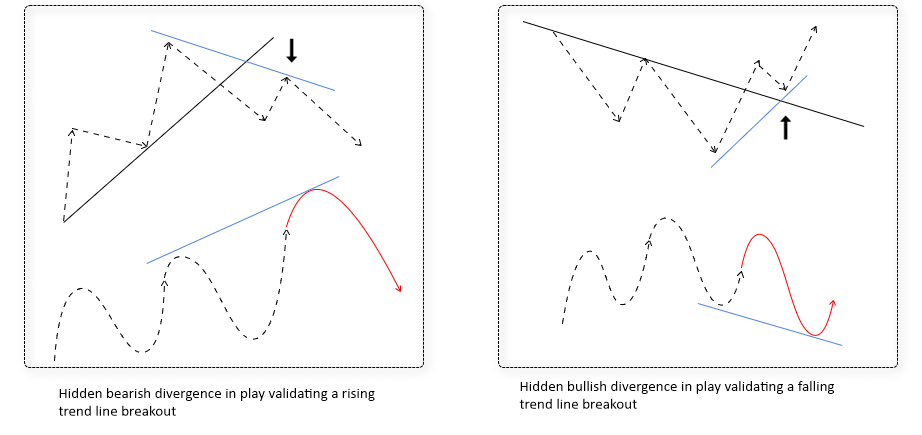
Using hidden divergence to qualify breakouts
Using divergence is a simple but effective way to avoid fake breakouts. By using this method, a trader can only look for qualified breakouts.
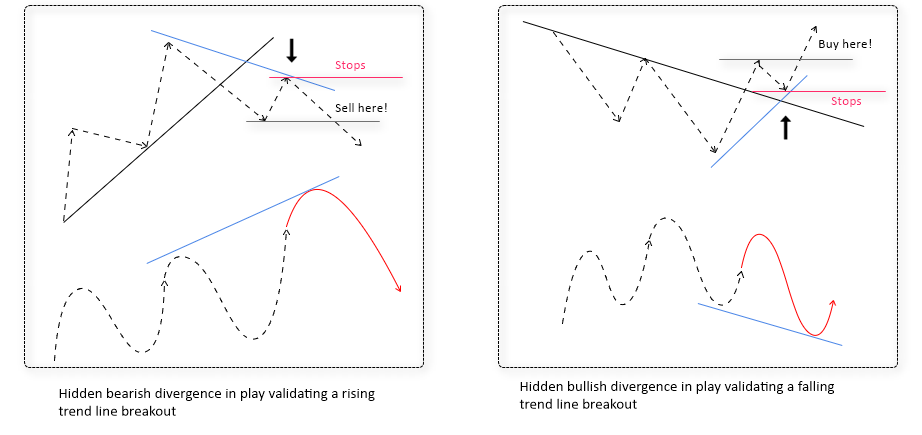
A hidden divergence (or reverse divergence) can be a bit complex compared to regular divergence. But it is quite simple really.
Bearish hidden divergence occurs when price makes a relative lower high while the oscillator (MACD or Stochastics or RSI) plots a relative higher high.
Bullish hidden divergence occurs when price makes a relative higher low, but the oscillator makes a relative lower low.
When applied to trend lines, traders can simply look for this set up to occur.
So, with a rising trend line, we look for short positions that are validated by the trend line break and a pullback to the breakout confirmed by the hidden bearish divergence.
With a falling trend line, we look for price to first break out but pull back to make a higher low. The divergence here should be a hidden bullish divergence.
Because in both cases price makes a lower high and a higher low, the stops can be placed around the recent pivot high or low.
If the above seems complicated, look at the chart below which illustrates this concept.
At which point do you initiate the trade?
So far, we have identified what to look for to validate a trend line break. But this still leaves out an important point. Where do you place your entry, stops, and profits?
Trades can be entered at the low (for rising trend line break short positions) or at the high (for falling trend line break long positions) that was formed after the breakout from the trend line. The stops are placed at the lower high (for short positions) or, the higher low (for long positions).
This is illustrated in Figure 4 below.
For-profits, you can either set a fixed reward of two times the risk or book partial profits at the most immediate support or resistance level.
Does this method always work?
No, and that is the nature of the markets. You won’t always find this textbook pattern to play out, but when it does, it signifies a high probability trade setup. You can trade this set up knowing very well that if you are stopped out, it simply invalidates the setup.
In some cases, you will find the divergence occurring even before the trend line breakout. You can also spot double tops or double bottoms with the divergence method.
Trade Examples
Figure 5 shows a short trade set up in play. Notice that the hidden divergence seen here is not a nearly textbook, but the chart pattern set up (trend line breakout -> rally -> divergence) gives ample hints of the impending downside movement in price.
In Figure 6, we have an illustration of a long position that is taken. Notice how this set up is slightly different to the way the divergence was formed in the short position example.
In conclusion, applying the concept of divergence can be a great way to objectively validate the trendline breakouts. Obviously, there is a choice traders need to make here. The set ups don’t occur all the time. But, when they do you can be sure of a high probability trade.
The downside is that traders need to be patient and scan the charts across different instruments and time frames as well.
Still, if you are looking a simple trading set up, that is objective and can give you higher profits than the amount you risk, the trend line breakout with divergence is a good start.

