
For the past four weeks, we have been stressing and following the US Dollar Index technical chart very closely, as we believed that a bearish pattern was in the making.
Indeed, at the start of this week’s trading, this pattern has been confirmed finally, which reaffirms our bearish outlook for USD Index for the next couple of weeks.
Head and Shoulders or Double Bottom?
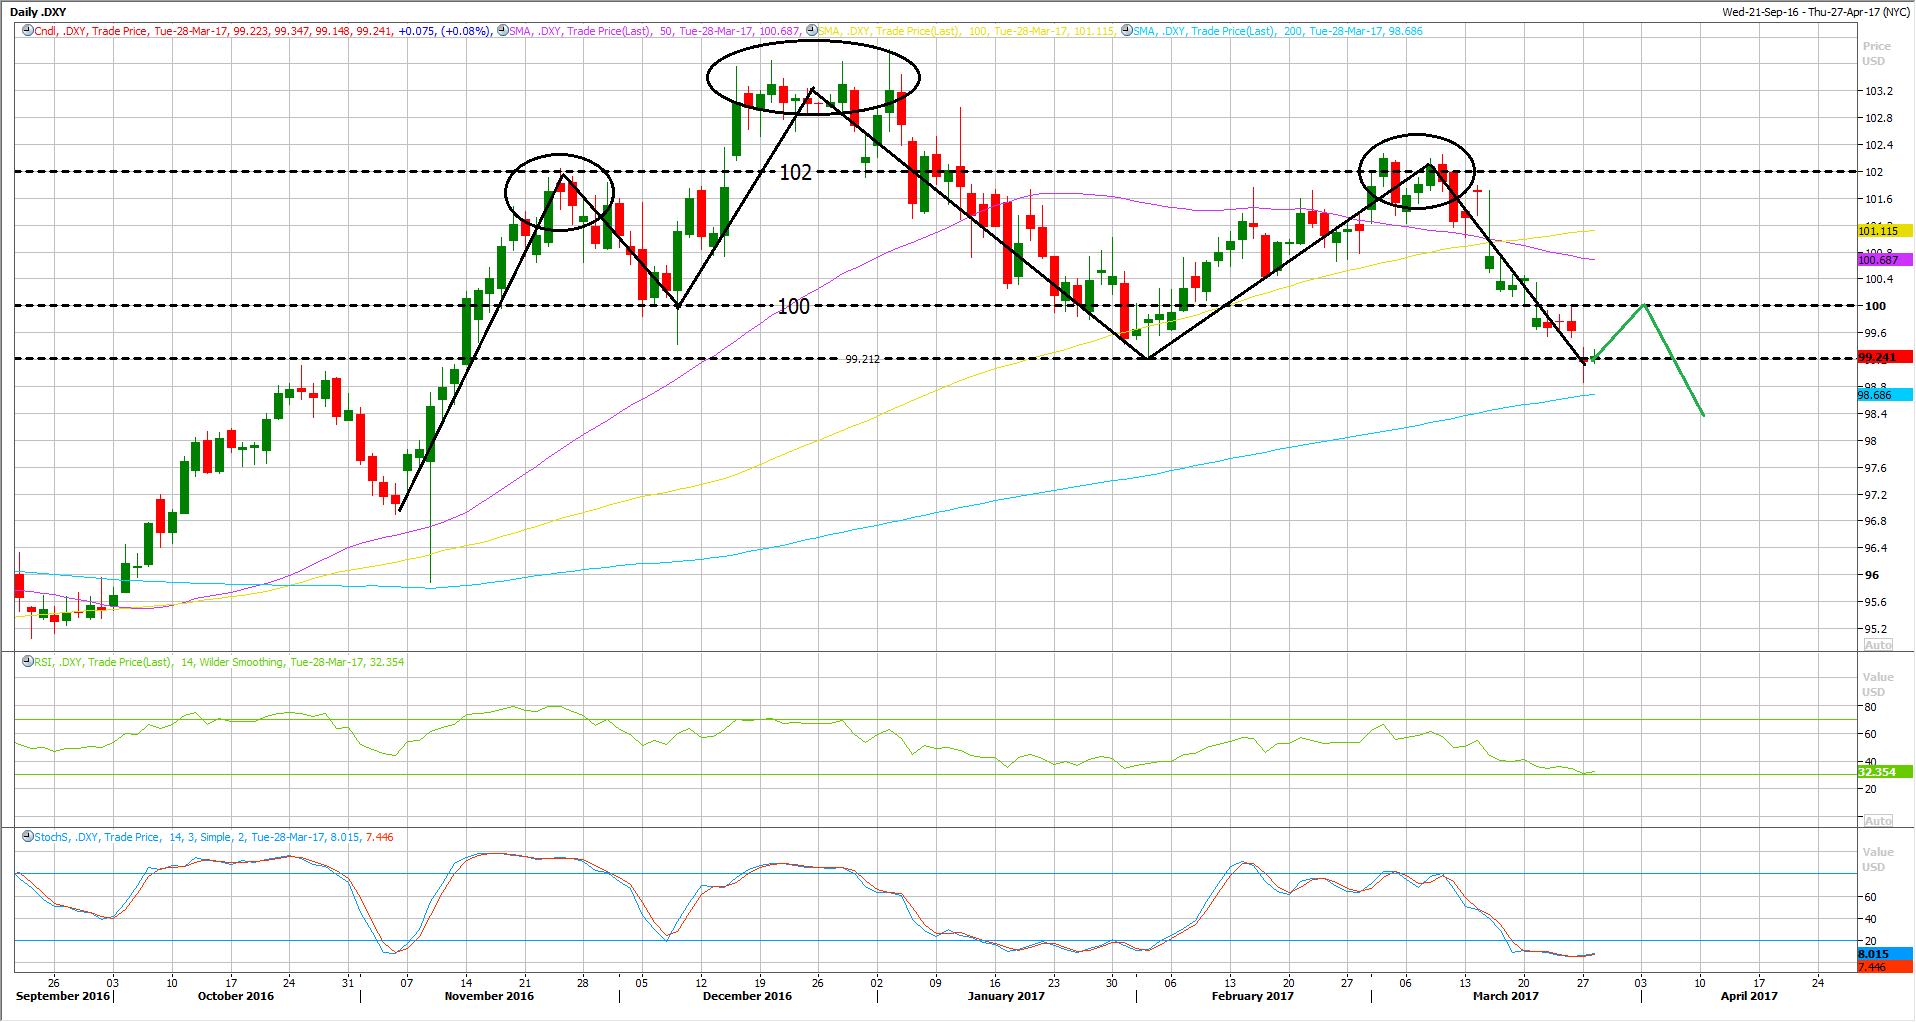

Looking at the daily chart, the left shoulder stands around 102.0 resistance area, while the head represents the highest level the index have reached back in December of 2016 around 103.40’s, while the right shoulder is around 102.20’s.
Despite the fact that this pattern is not a perfect head and shoulders pattern, yet, the neckline stands around 99.20’s.
Some would say that this might be a double or triple bottom pattern. However, what keeps the bearish outlook in place if the crossover of the 50 DAY MA below the 100 DAY MA, which is called the death cross, and this is a bearish signal on the medium term.
Technical Indicators Are Heavily Oversold
Looking at the daily chart, the technical indicators are heavily oversold on most time frames, whether on the daily and the weekly chart, while the monthly has more room for further declines ahead.
Stochastic oscillator is heavily oversold and flat at the same time, trading around 8.36, while the RSI indicator is trading near the lower band around 33.0.
With indicators are heavily oversold on most time frames, another upside retracement is highly possible before the trend continues.
Technical Retracement?
For the time being, after the clear breakthrough 100 barrier, side by side with oversold technical indicators should keep the possibility for a short-term retracement to the upside.
Yet, any retracement is likely to be limited in the coming hours or days, below the same 100 barrier, which should be watched closely, where sellers are likely to appear.
Otherwise, a break above that resistance would eliminate the head and shoulders formation, and might even change the bearish outlook to bullish once again. However, this unlikely over the next few weeks.
What’s After The Retracement?
I would like to see a clear action around the 100 barrier, meaning a touch with a reversal to the downside again in order to resume its downtrend.
The 100 barrier should hold over the next couple of weeks, where I would be interested in keeping on shorting the US Dollar against various currencies, including the Euro and the Japanese Yen.
After the potential retracement to the upside, the downtrend should accelerate, which means that I would be interested to see a clear break below this week’s lows around 99.0, which likely to open the way to test the next key support which stands at 98.68, which represents its 200 DAY MA.
Moreover, I would suspect a possible breakthrough that support, which should clear the way for a deeper decline in the next few weeks.
Fundamental Catalyst
Today, we will be waiting for few economic releases during the US session, which set to have only a medium impact on the markets. Unless they comes with a notable surprise.
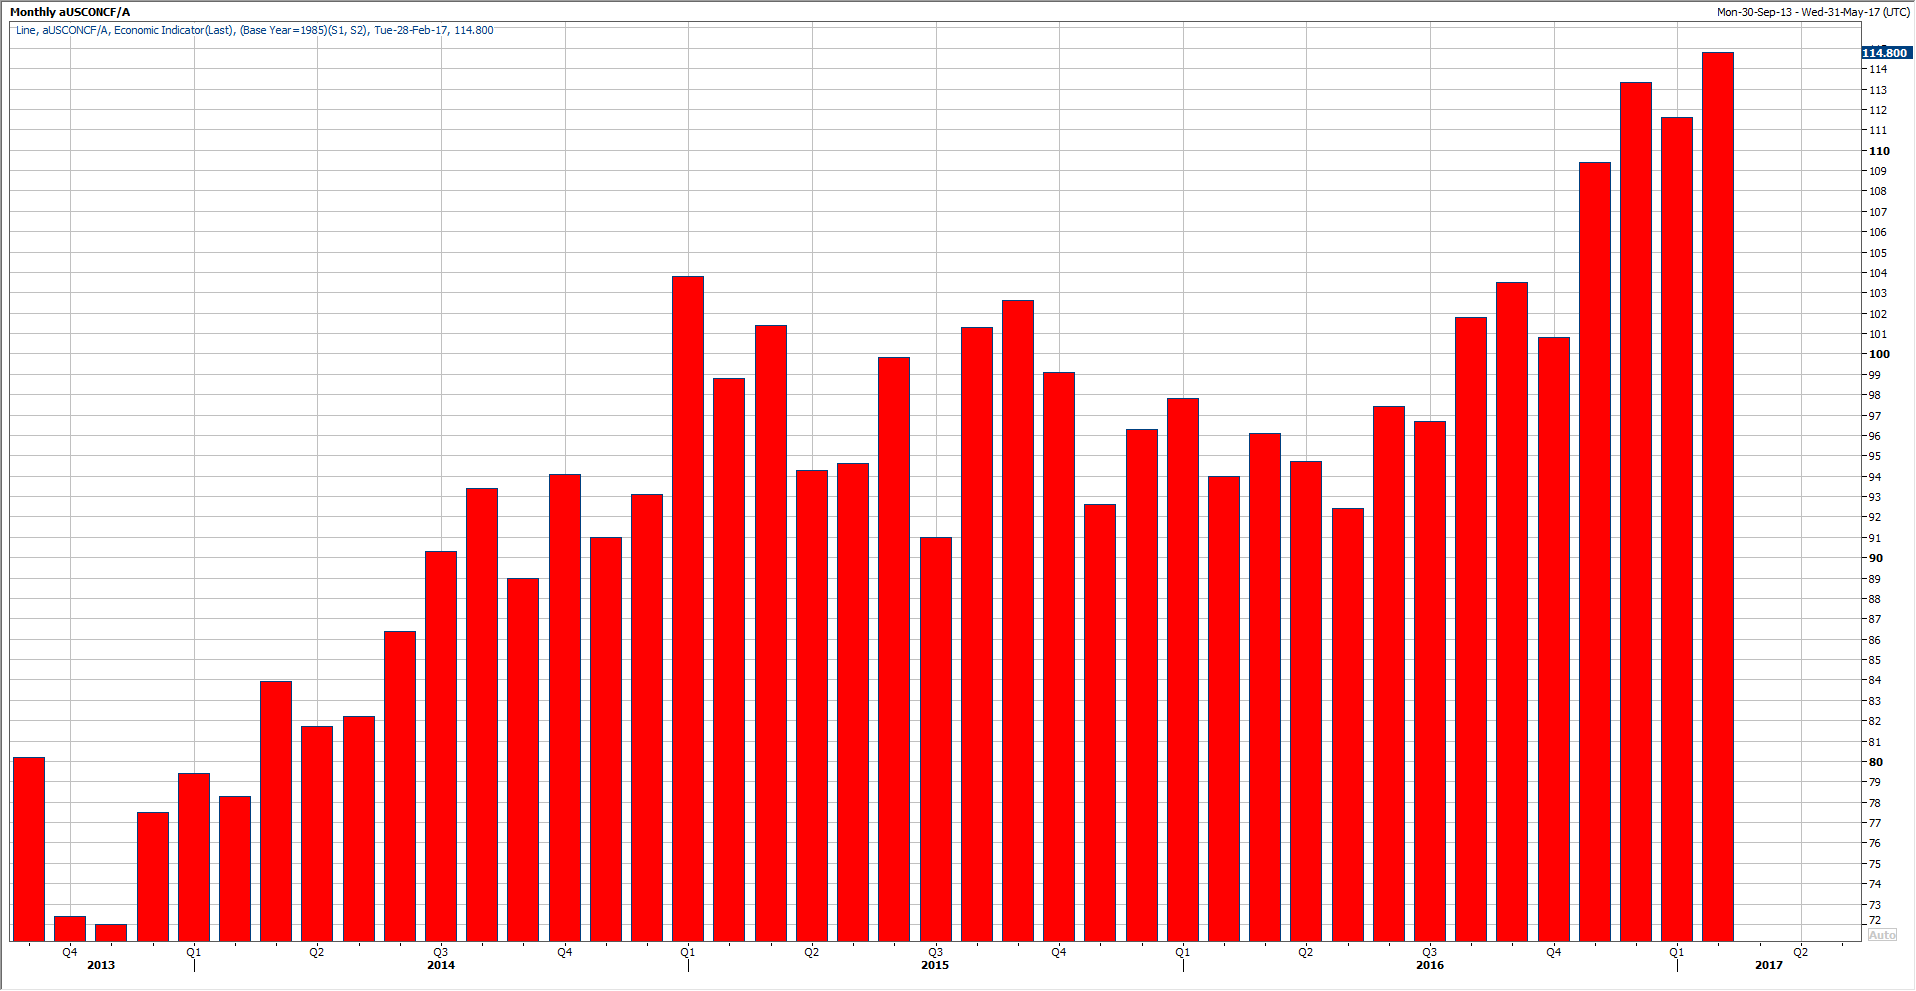
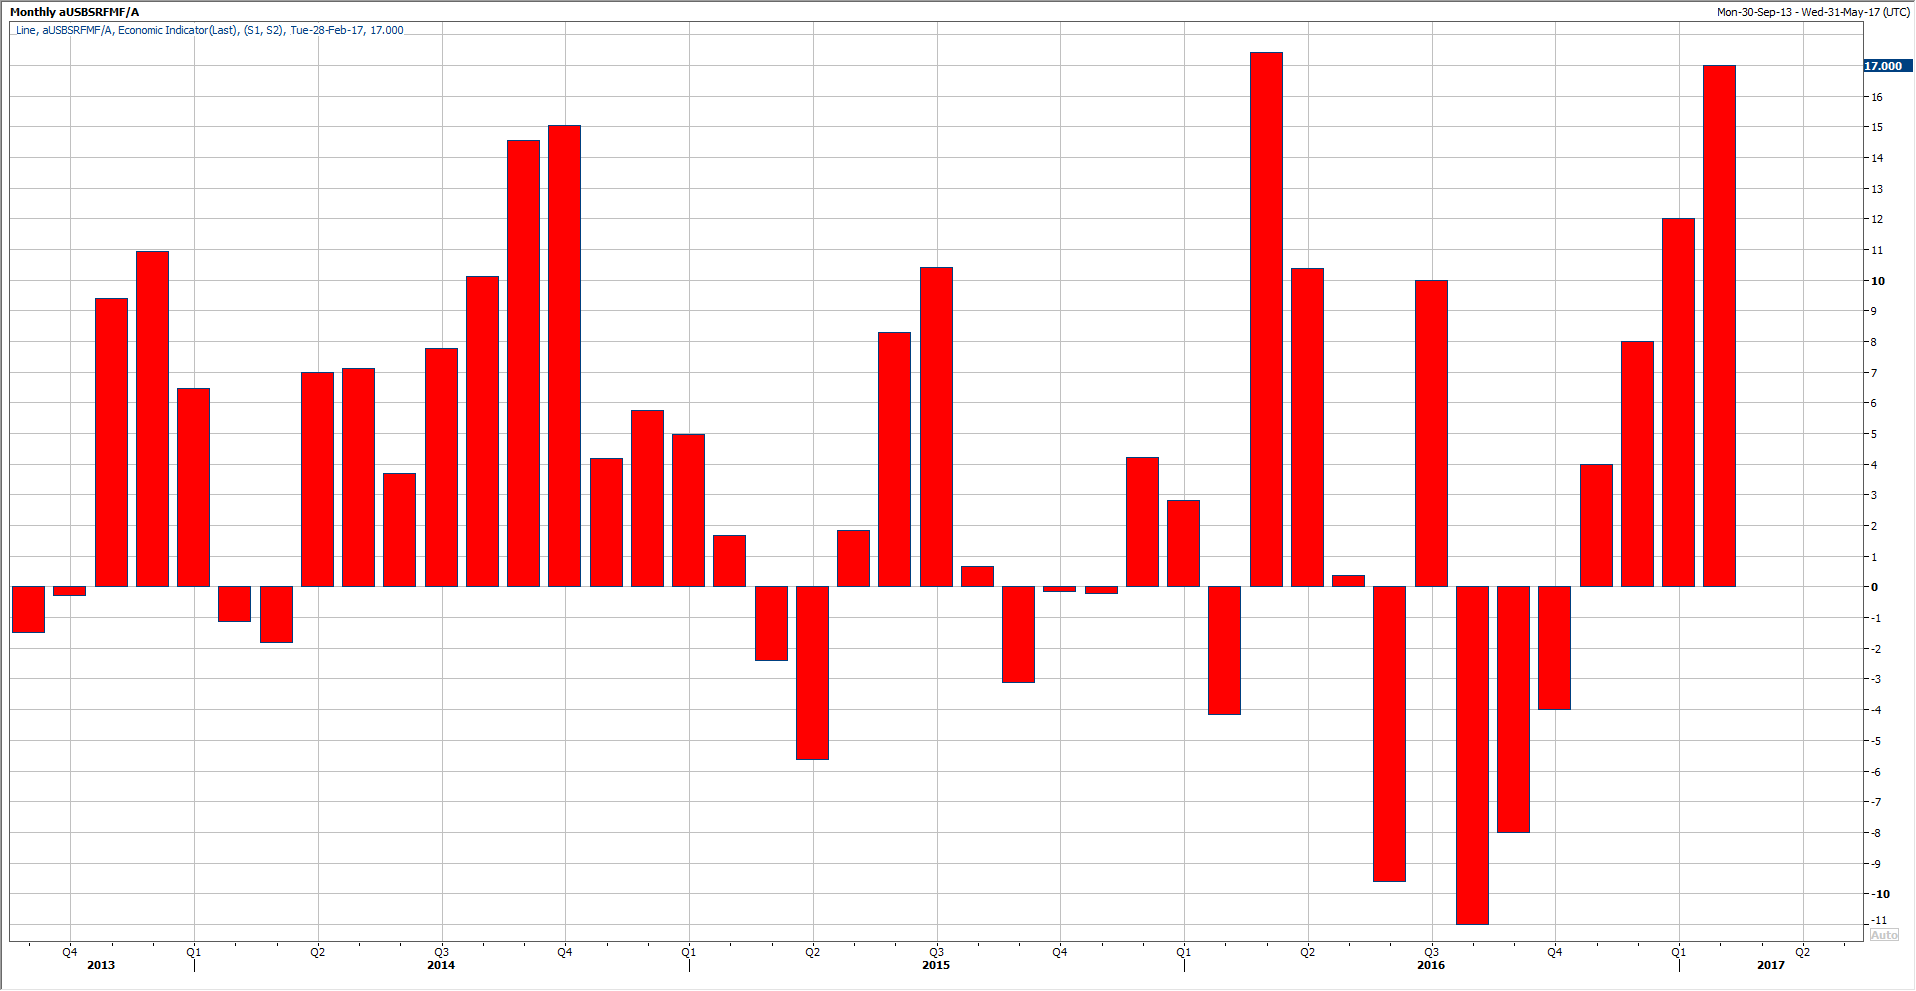
However, the CB Consumer Confidence is expected to ease back side by side with Richmond Fed Manufacturing Index.
A positive surprise might be the catalyst for the US Dollar to start retracing to the upside once again. On the other hand, a notable disappointment might be the catalyst for another dip lower across the board.
Yet, traders should not rush in to shorting USD from the current levels. If you didn’t short from the 100 barrier, don’t rush to short at the lows. Always try to short in to strength and long in to weakness.

