Following the speculative rally by the equity markets and the U.S. dollar following the election victory of Donald Trump, nearly four months later, the markets have nothing to go by from President Trump.
Last week, the U.S. dollar fell below the psychological round number level of 100.00 as investors pared bets on the so-called “Trump Trade,” where President Trump is yet to make good on his election promises.
The skepticism among investors was evident as the majority of equity markets, both in the U.S. and abroad pulled back while the U.S. dollar eased back from its gains.
The obvious winner so far is the Japanese yen which is viewed as a safe haven asset. USDJPY broke past 112.00 last week, another key level in the currency pair and had been trading weaker ever since. The U.S president has promised tax cuts and $1 trillion in spending on the U.S. infrastructure construction but has failed to provide any further details so far.

In late February, the President tweeted that a new tax plan was to be announced towards the end of the month, but all of that failed to materialize.
Meanwhile, the U.S. Federal Reserve maintained its stance of two more rate hikes coming up this year. After raising the short-term Fed funds rate to 0.75% – 1.0% in early March, the Fed did not change the narrative thereafter.
The markets were slightly disappointed on the news as some expected that the Fed could increase the pace of rate hikes to three instead of two.
The above factors combined are likely to weigh on investors’ minds. However, the question that is likely to plague almost every investor would be whether this is a correction to the Trump trade that could see further upside or if this is just the beginning of a longer term correction.
U.S. Dollar Index – Correction to 96.00 – 96.30
Not so long ago, technical analysts were abuzz with the head and shoulders pattern that was evolving on the U.S. dollar index, something which we wrote about as well. However, the pattern was cloudy and not as perfect as the textbook pattern for the head and shoulders one gets to see.
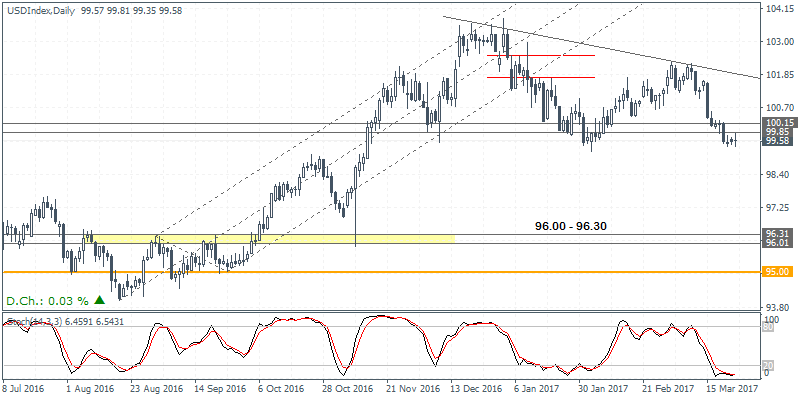
While the right shoulder formation has been rather delayed, the fact remains that the downside bias is starting to increase, as the descending triangle pattern is starting to unfold, connecting the highs from late December 2016 and early January 2017 and the recent lower highs formed around early May 2017.
The support level seen at 100.15 – 100.00 marks the support level for the descending triangle (alongside the fact that this is also the head and shoulders pattern support level).
With price failing to make a higher high and instead reversing off 101.72 – 102.50, the current breach of the support at 100.00 could signal a continuation to the downside.
Thus, the lower support seen at 96.00 – 96.30 will be quite likely tested in the near term.
While this can be called a correction, the U.S. dollar index will need to give further signs of a change of trend in order to ascertain if the U.S. dollar index will continue to weaken further.
More importantly, watch for signs of lower highs forming below 100.00 after which a break down past the 96.00 – 96.30 could signal further downside and potentially a change of trend in the greenback.
On the economic front, key catalysts will come in the form of the final revised GDP due on Thursday, March 30th which covers the final quarter of 2016.
For the markets to recover and for the U.S. dollar to resume its rally, there is a possibility that President Trump will have to discuss his tax cuts and infrastructure plans in order to revive some hope among investors.

![Credit Card 160×600 [EN]](https://assets.iorbex.com/blog/wp-content/uploads/2023/06/13144507/Blog-Banner_EN-Banner_160X600X2.webp)