
There are certain kinds of traders who prefer to trade with a simplistic, no frills attached trading system. For the most part, traders tend to over complicate things when it comes to trading and it is very often that we come across a trading strategy or style where the indicators tend to overwhelm the charts, to the point that the most important element in the analysis, which is price, tends to be ignored.
Then there are trading strategies, especially multi-time frame approaches that require traders to consider many different variables, all in the effort to make profits.
But what if there was a trading style that is so simple that takes just a few minutes to come to a consensus before you trade? And what if there was such a trading strategy that offers an inbuilt risk/reward system as well?
In this week’s trading strategy, I introduce you to one such method that is not only simple to trade but one that you will enjoy. But a word of caution, we don’t use any indicators and instead focus on just price.

Yes, you guessed it; this is a price action trading strategy. But don’t let that out you off and soon enough and with decent practice, you can find it comfortable to trade with this approach.
Setting up your charts
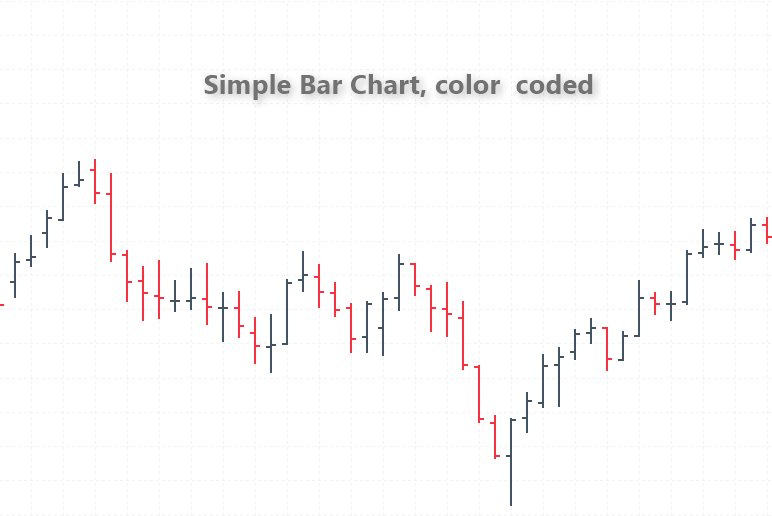
We make use of bar chart, which is simple. Just make sure that you color code the bars so you can distinguish between bullish and bearish bars. Feel free to set the color preference of your choice. Once you are done with this task, your bar chart looks like the one below (with, of course, the colors of your choice).
The trade management tool
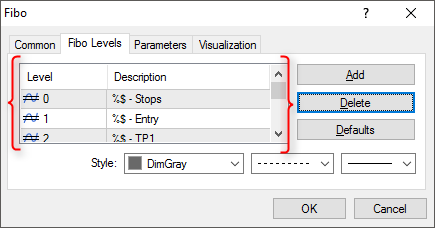
For the trade management tool, we take the trusty Fibonacci retracement tool and simply re-configure the values.
To do this, select the Fibonacci retracement tool and plot it anywhere on the chart, right click on the Fibonacci tool to open the properties window. Click on the ‘Fibo Level’ tab and enter the following values.
| Level | Description |
| 0 | %$ – Stops |
| 1 | %$ – Entry |
| 2 | %$ – TP1 |
| 3 | %$ – TP2 |
| 4 | %$ – TP3 |
Now that we are done, the next step is to define the trading pattern that occurs.
Trading Pattern and Trade Trigger
- Identify the prevailing trend on your chart time frame.
The trend can mean different things to different people. To remove this confusion, the trend in the context of this trading strategy is defined a series of consecutive highs or lows. Because this trading strategy is based on individual bars, look for 5 or more consecutive red or green bars.
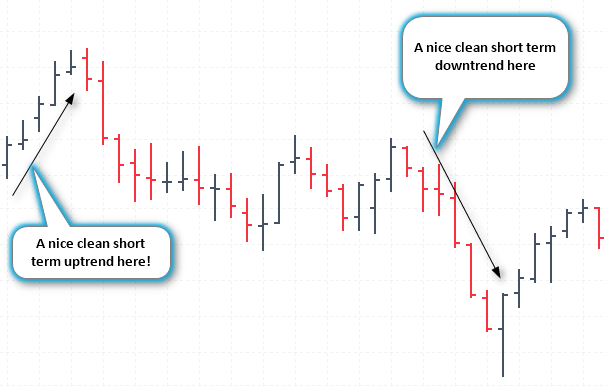
But the above set up is a text book pattern, and such occurrences (5 consecutive highs or lows) do not occur too often. Therefore do not be too strict about but at the same time look for a consistent pattern. For example, you can have just three strong bullish or bearish bars, which qualifies as well.
- The reversal
For the reversal, we look for three bars that match the following criteria.
In a downtrend (and therefore for long positions),
- bar 1 must make a new low and a new lower high
- bar 2 must make a new low (breaking below the previous or bar 1 low), but should close bullish and at least above 50% of the previous bar
- bar 3 should make a higher low and a higher high above bar 1’s high
- Of course, it goes without saying that there should be a clear downtrend established of at least 5 bars or more
In an uptrend (and therefore short positions),
- bar 1 must make a new high and a new higher low
- bar 2 must make a new high (breaking above the previous or bar 1 high), but should close bearish and at least below 50% of the previous bar
- bar 3 should make a lower high and a lower low below bar 2’s low
Once the criteria is formed, use the Fibonacci tool and connect bar 3 high and bar 2 low (for long positions) or bar 3 low and bar 2 high (for short positions).
- The trigger
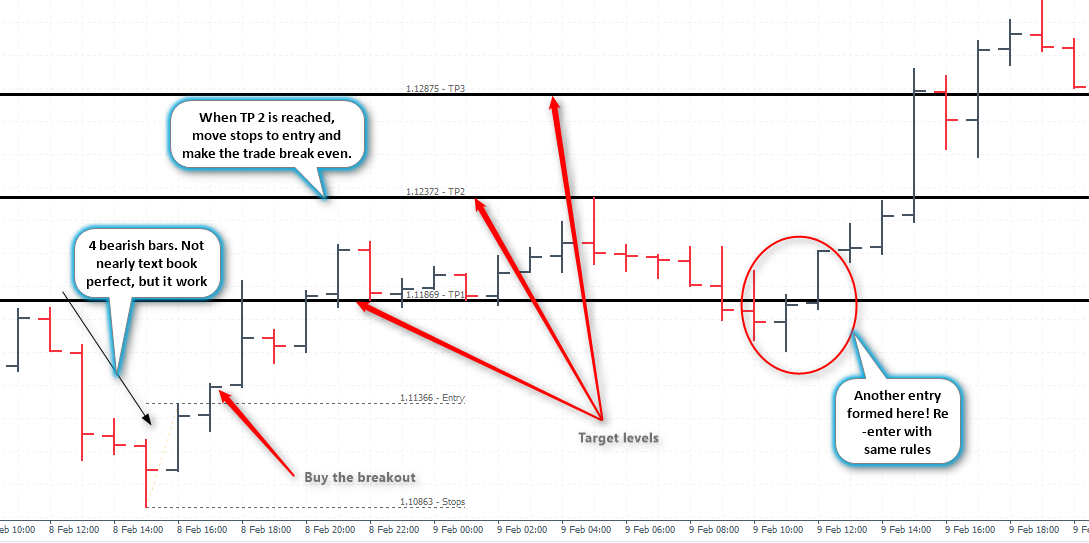
For long positions, buy the breakout above bar 3 high or if you miss the move, set a pending long order at bar 3 high. Set stops to bar 2 low with TP1, TP2 and TP3 coming in as the three target levels for your trade.
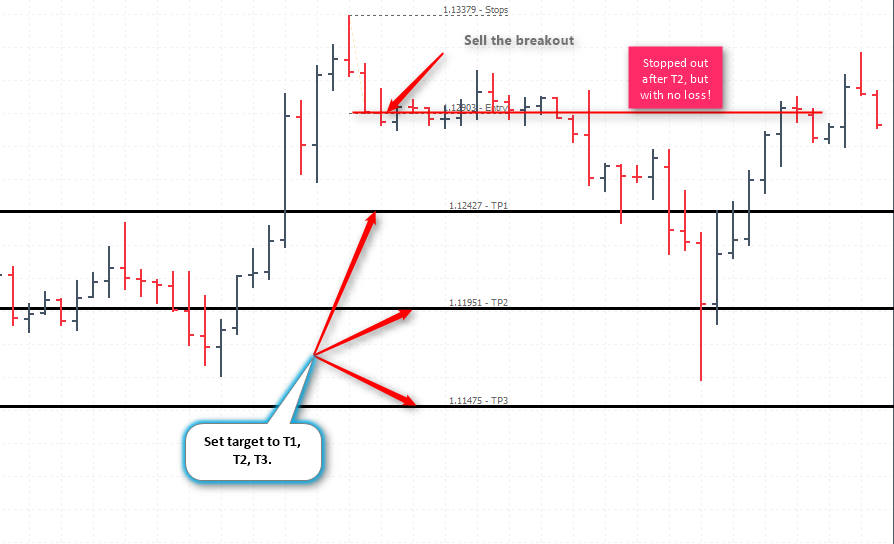
For short positions, sell the breakout below bar 3 low or a pending sell order with stops at bar 2’s high with TP1, TP2, and TP3.
The chart below shows the long position, and also shows a second set up that was formed within the first one.
The next chart below shows a short set up formed, but here the trade progressed only to T2 before reversing. Still, we got out of the trade with no loss and with a profit of 1:1 and 1:2.
Final thoughts – 3 bar reversal
- The strategy works on any time frame but limits it to H1 and higher
- The strategy offers a good risk reward set up and doesn’t take too much of your time for analysis
- The 3 bar reversal method is a counter trend method. But a strict stop loss ensures your trades are managed properly
- The 3 bar reversal method doesn’t require much of analysis, and you get to trading quickly
- With no indicators being used, this method is simple to trade

