
NYMEX Oil Futures contracts for October delivery closed 2.80% lower to settle at $46.79 a barrel on Wednesday. Oil prices extended the declines from earlier this week as the weekly crude oil inventories report from the Energy Information Administration (EIA) showed that for the week ending August 19, US crude oil stockpiles increased 2.5 million barrels. This was significantly higher than the expectations of a 0.5 million drawdown. Last week’s oil inventory report also reversed the build up from the week before where inventories fell by 2.5 million. Earlier in the week, the American Petroleum Institute’s gauge of oil inventory had flashed a 4.5 million build-up in inventories.
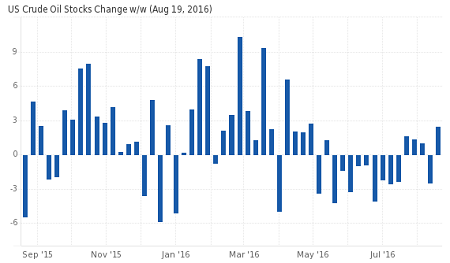
Gasoline supplies stayed flat for the week while stockpiles for distillates rose 100k barrels, the EIA’s report showed. Following the release, oil prices lost over 1.50% after a failed attempt to challenge yesterday’s minor support at 47.50 turned to resistance. A stronger US dollar also helped to keep the pressure on oil prices.
[Tweet “Week ending Aug. 19, US crude oil stockpiles rise 2.5 million. Exp. -0.50 million #CL #Crudeoil”]

OPEC’s informal talks – Much ado about nothing
While the weekly inventory report keeps oil prices volatile, traders remain focused on the upcoming informal meeting of OPEC members on September 26 – 28 on the sidelines of the oil forum meeting in Algeria. Despite some optimism, the widely accepted fact remains that with Saudi Arabia ramping up production, citing ‘summer demand’ and Iran unwilling to budge, the September Algeria meeting is likely to be a repeat of the Doha talks earlier this year. Olivier Jakob of PetroMatrix in Switzerland said, “There is currently a race to print any freeze headlines, but we have not yet seen strong substance behind them.”
[Tweet “#OPEC Agree to disagree! September 26/28 (informal) meeting”]
Will oil prices fall back to $40 a barrel?
John Kilduff from Again Capital thinks so. In an interview with CNBC’s ‘Squawk Box,’ Kilduff said “I think we’re going to go back down to at least $40 and possibly the mid $30s” Kilduff said that despite some on-off hawkish comments from Saudi Arabia, the wider argument remains that with individual oil producers ramping up production, there is nothing to substantiate the hawkish narrative. Joining Kilduff are many other mainstream analysts who expect oil prices to fall between autumn and spring. Tom Kloza, from OPIS, said, “even if crude supply moves unmistakably into balance, markets will still have to work through record stocks of refined products, particularly gasoline.” Fadel Gheit, a senior energy analyst at Oppenheimer & Co., said, “We have to recognize that oil prices are likely to remain lower for longer than expected.”
What about the inverse head and shoulders pattern?
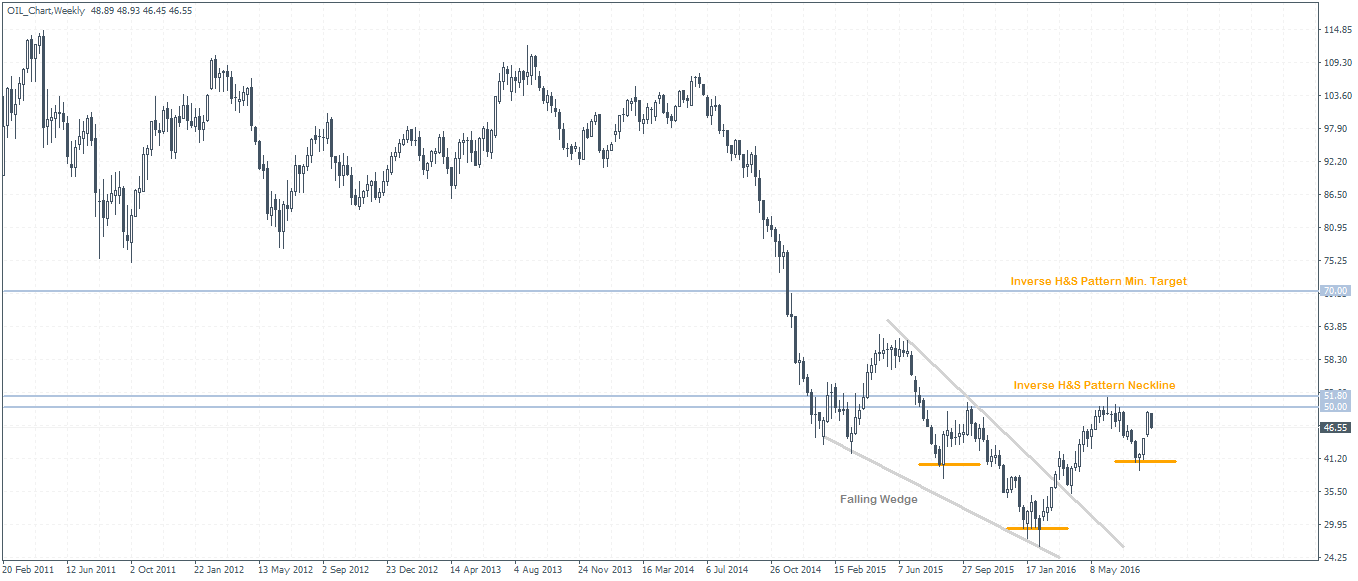
While analysts expect oil prices to fall back to the $40 handle (give or take), the technical chart for Oil (rolling contract) shows otherwise. The weekly chart for crude oil shown below shows the inverse head and shoulders pattern that is clearly standing out with the neckline resistance at 51.80 – 50.
[Tweet “Will this inverse head and shoulders pattern turn bullish for #oil? http://bit.ly/2bhQXEQ”]
The pattern evolved after price broke out from the steep descending/falling wedge pattern. The only question now is whether this current short-term decline is merely just that.. short term or will price continue to extend lower, breaking below the right shoulder’s low at $41.20.
On the 4-hour chart, the technical outlook for oil remains to the downside with a test of support around 43.42 region which previously acted as minor resistance before giving way for the strong upside rally in oil that we saw during the first two weeks in August.
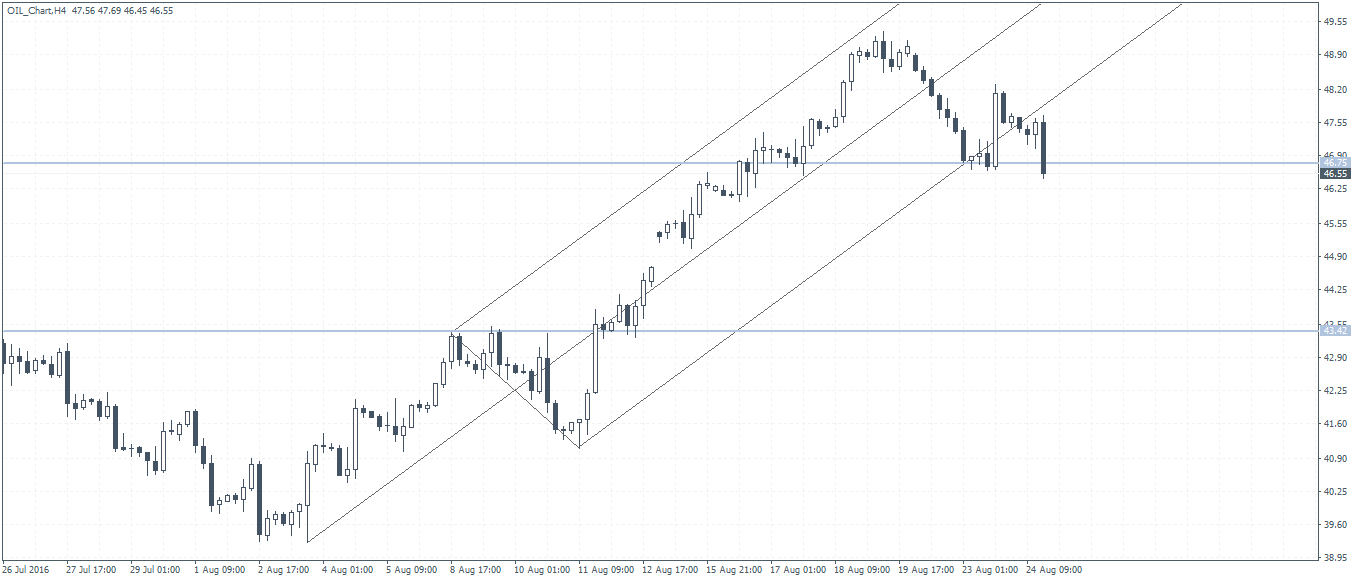
Putting this in perspective, any signs of a potential reversal near the 43.50 – 42.50 region on the 4-hour chart, confirmed later by a bullish reversal candlestick pattern on the daily chart could signal an early confirmation for the weekly inverse head and shoulders pattern.

![Credit Card 160×600 [EN]](https://assets.iorbex.com/blog/wp-content/uploads/2023/06/13144507/Blog-Banner_EN-Banner_160X600X2.webp)