
Gold prices finished the month of May, down 6.05%. The month of May also saw gold prices touching a 15-month high at $1303.6. Gold sold off, weaker ahead of increasing speculation that the Federal Reserve was preparing to hike rates either in June or July, with the June hike probability at 20%. Last week’s Commitment of Traders report showed that while speculators cut their long positions by 56k to 156,500 contracts, marking one of the steepest weekly falls in the institutional ownership. On the same note, the commercials group increased to net longs, in what was the steepest increase.
Earlier on Monday, gold slipped to test briefly the $1200 psychological barrier, which was last tested in February this year on the bullish rally. While prices bounced off this level earlier this week, a firmer test of this support level cannot be ruled out. This week, economic data that could shift the sentiment around includes today’s ISM manufacturing index followed by this Friday’s monthly payrolls report. US economic data has managed to get off on a strong footing so far, boosting expectations of strong growth in the second quarter this year and supportive of another Fed rate hike. The equity markets are also showing signs of taking the rate hike in their stride.
Commerzbank analysts said that gold prices could fall another $50, noting in their research. Analysts said “The Fed was also the trigger back then when it surprised observers with a hawkish accompanying statement after its meeting at the end of October, thereby preparing the market for a rate hike in December. At that time the gold price dropped from $1,200 to $1,050 by mid-December. In other words, the gold price could still fall by around another $50.”
Gold – Technical Outlook

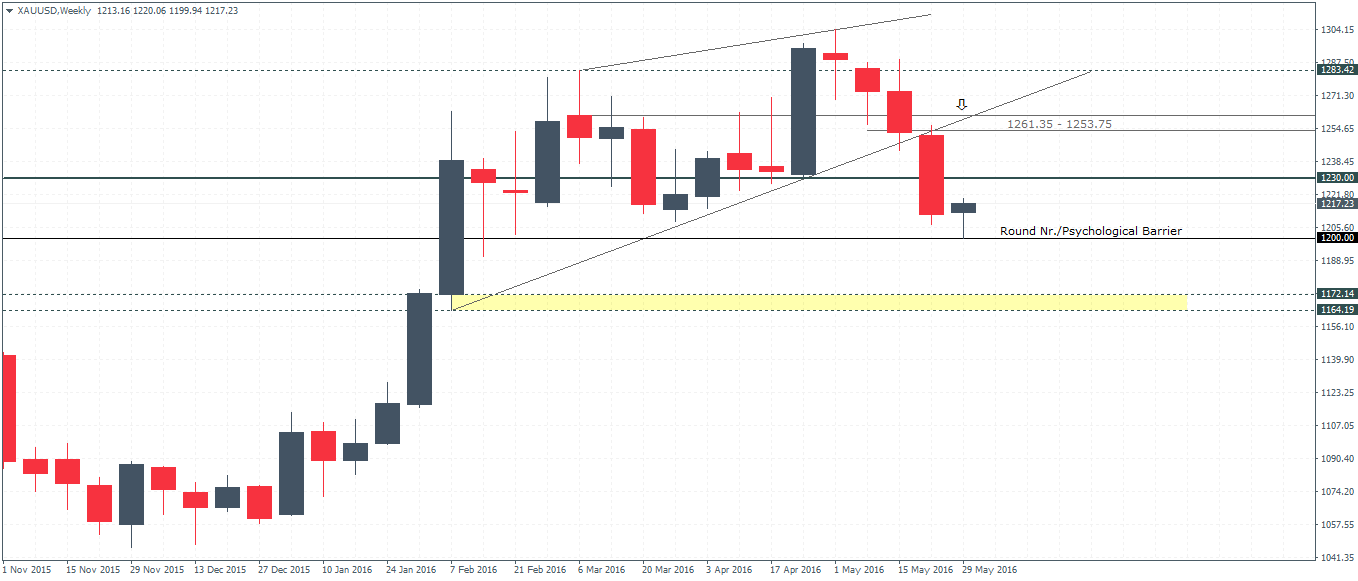
The weekly chart for spot gold shows prices currently bouncing off the 1200 level after price posted a low to 1199.94 this week. A follow through here is needed for a confirmation of a retracement. To the upside, 1230 support remains the initial resistance level that will need to be cleared. An upside break above 1230 will see gold extend gains to 1261.35 – 1253.75 resistance, which will mark a retest of the breakout level. Ideally, having this retracement to 1261.35 – 1253.75 over the next 2 – 3 weeks would be ideal with the pattern confirming an eventual move lower, back to 1200 initially followed by 1172 – 1164. Therefore, this week’s close will be of importance.
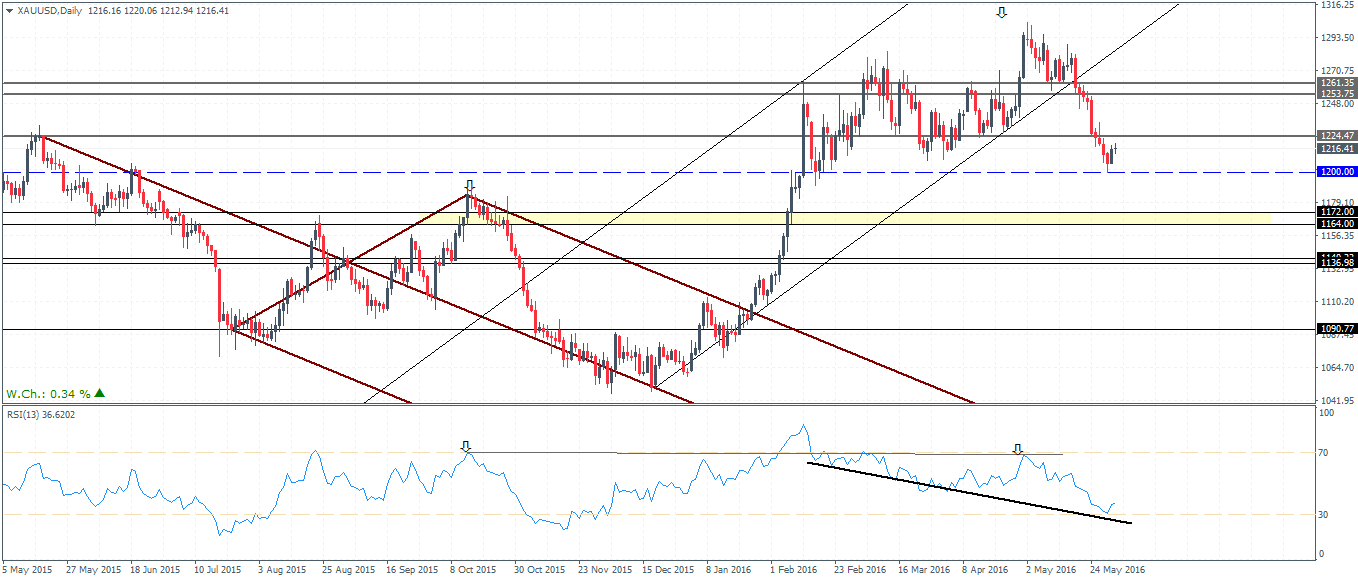
On the daily chart, the 13 period RSI is showing a hidden bullish divergence near the 1200 support, with the RSI making lower lows while price makes a higher low in comparison. Given that 1200 is a strong level, combined with the hidden bullish divergence, gold prices could see some consolidation at the current levels before pushing higher.
The near-term upside in gold is more or less pointing to a short-term recovery in prices. Looking ahead the economic data over the weeks will likely shape the expectations for the June FOMC meeting, which is likely to see the volatility in gold prices. Adding to the noise will be the outcome of opinion polls on Brexit as well which could affect gold price volatility.

![Credit Card 160×600 [EN]](https://assets.iorbex.com/blog/wp-content/uploads/2023/06/13144507/Blog-Banner_EN-Banner_160X600X2.webp)