The ICE Futures US dollar index took a beating following last Friday’s monthly payrolls report. A surprisingly dismal jobs report with downward revisions to the past two months saw the markets discount a rate hike. The CME futures rate hike probability now stands a little above 1% for a rate hike at the FOMC meeting next week. Earlier this week, Janet Yellen’s speech at Philadelphia did not offer much. The markets deciphered the speech for what was not said and came to the conclusion that Fed will likely hold off from hiking rates next week. Be that as it may, pundits argue that with the UK referendum vote due in under two weeks time, the Fed would likely refrain from adding more volatility using a rate hike.
It has been nearly 5 months since the Fed hiked rates in December by 25bps. The S&P500 e-mini futures closed that day (December 16th) at 2056.50 followed by a sharp correction to 1820 by mid-February. The S&P500 e-mini futures closed yesterday just a few ticks below 2120, or about 2.81% since December. The US dollar index, on the other hand, closed December 16th at 98.58 and is currently down 4.58% since then.
While the first quarter GDP has been slower than expected, subsequent revisions saw the GDP growth being revised higher. Stepping into the second quarter, US economic data continues to remain upbeat, although next week’s retail sales report will show whether the surprise gains last month was for real or just a flash in the pan.
While the Fed may or may not hike rates next week, the technical landscape, looking at the US dollar index shows that price is exactly where it wants to be, which is near a support level. Yesterday’s bullish close is perhaps an early signal for that.

US Dollar Technical Outlook
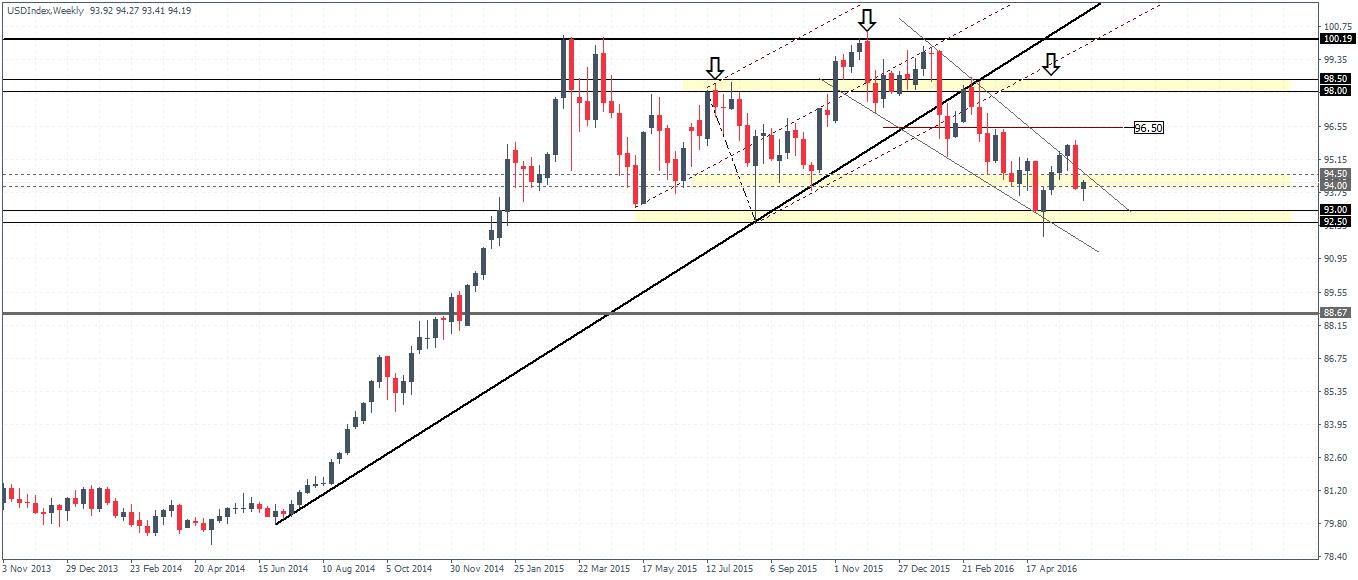
The weekly chart shows the dollar index falling back to a familiar support level after hitting lows near 93 – 92.50 nearly five weeks ago. While we need to see evidence of a bullish close on the weekly basis, the fact that the dollar index has managed to hold up above 94.00 points to the fact that the support level is strong enough to stem further declines in the dollar. We continue watching the dollar index for the potential head and shoulders pattern that is evolving with the right shoulder expected to be completed anywhere near 96.50 and 98.00 – 9850 resistance levels.
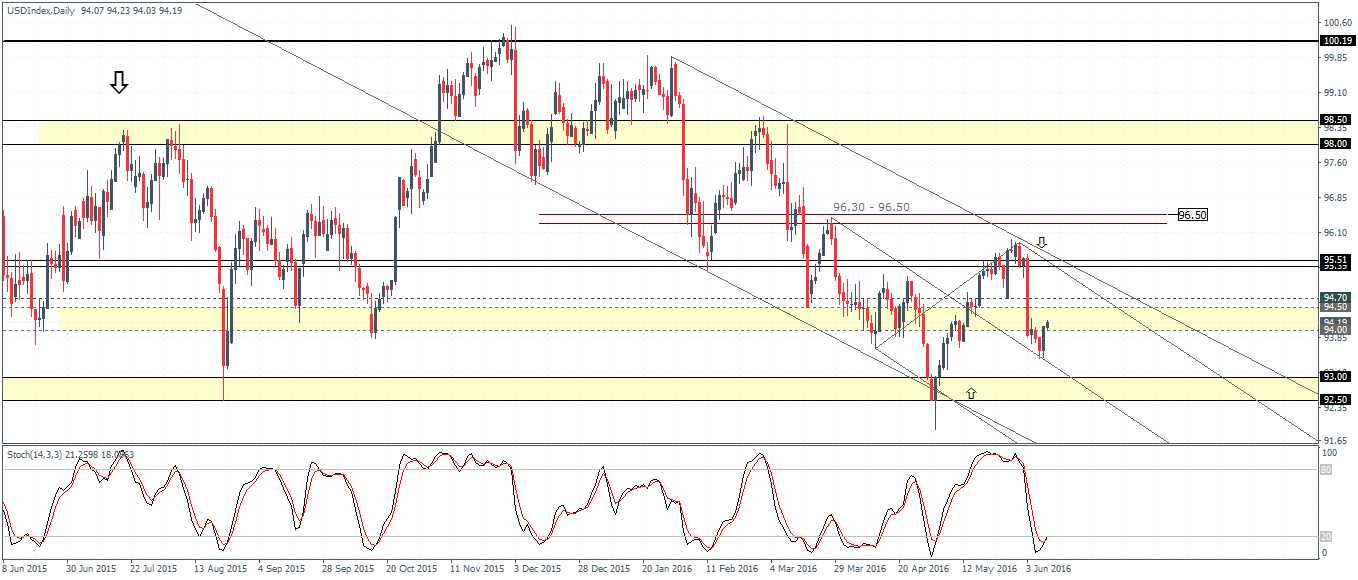
On the daily chart, the dollar index, although moving within a falling price channel is showing some early signs of a move to the upside. Immediate resistance comes in at 94.70 – 94.50 followed by 95.50 – 95.40 levels likely to be challenged. Clearing this resistance would most likely pave the way for the dollar to rally towards the next main resistance at 96.30 – 96.50.
To the downside, unless we see a bearish close below this week’s low around 93.50 – 93.40, price action is likely to remain biased to the upside. A break below 93.50 – 93.40 could see the dollar index fall back the previous support at 93.0, but still the bias remains to the upside. The narrative shifts only if the dollar manages to clear out the 93.0 support in which case we could expect to see more declines in store.
The week ahead will be an important one especially with retail sales numbers lined up ahead of the Fed’s meeting. No one can say for sure on the Fed’s decision next week but keep an eye out on the dollar which could turn bullish if circumstances fall in favor.

![Credit Card 160×600 [EN]](https://assets.iorbex.com/blog/wp-content/uploads/2023/06/13144507/Blog-Banner_EN-Banner_160X600X2.webp)