
WTI Crude oil prices were supported to the upside as prices hit new yearly highs on Wednesday. The weekly US crude oil inventory report from the Energy Department showed a continued decline in stockpiles. After rising 1.3 million in the week ending May 13th, US commercial stockpiles fell 4.22 million for the week ending May 20th. The declines in the EIA’s report closely matched that of the API, which earlier this week reported a drawdown of 5.13 million barrels, extending the declines from the previous week’s reported 1.14 million decline in stockpiles.
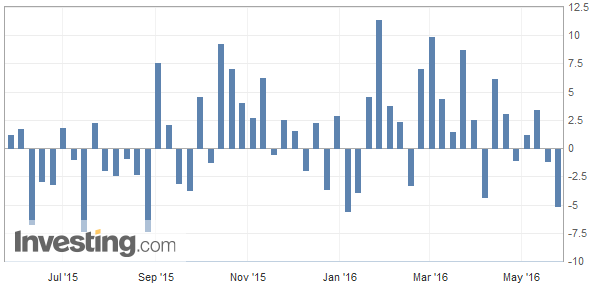
Weekly Inventory Report – API (-5.130Mn) For May 20, 2016
Crude oil futures for June delivery (CL_6N) touched a high of $49.75 a barrel and in early trading today, prices inched higher to $49.92.

After initially struggling with oversupply two years ago leading to most US oil companies cutting down on spending and new exploration, production was seen to be declining at least from the US alongside production outages in some of the world’s largest oil producers such as Canada, Nigeria, and Libya.
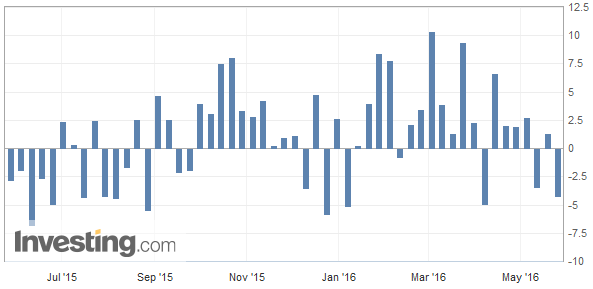
Weekly Inventory Report – EIA (-4.22Mn) For May 20, 2016
Taking a bullish call and joining the ranks of Goldman, Citigroup in a note yesterday said “Crude oil prices flirt with $50, as supply disruptions stack up on top of accelerating declines in…oil production.” while Price Futures Group analyst Phil Flynn said “The trend of…lower-than-expected output is going to get us above $50” in the coming days.“
While WTI Crude oil futures attempt to break the $50 handle, Brent futures pushed above the $50 handle in early trading today for the first time in seven months. Many analysts believe that the $50 mark in both Brent and WTI will be a psychological barrier. Ric Spooner from CMC Markets says “(From a) practical point of view will there or will there not be a sustainable increase above $50? At the $50-$55 range, there has got to be a good chance of seeing the peak. There is a momentum, people will try and push it up over that.”
Crude Oil Technical Outlook
The weekly oil chart shows prices extending the gains for the third consecutive week and is now inching closer to the $50.92 handle. A weekly close above this level could see some pullback but could validate that prices will continue to move higher. Support at $45 – $44 could be tested ahead of a break above the $50.92 handle. The hidden divergence continues to build up on the chart, but unless there are signs of a reversal, the bias remains strongly poised to the upside.
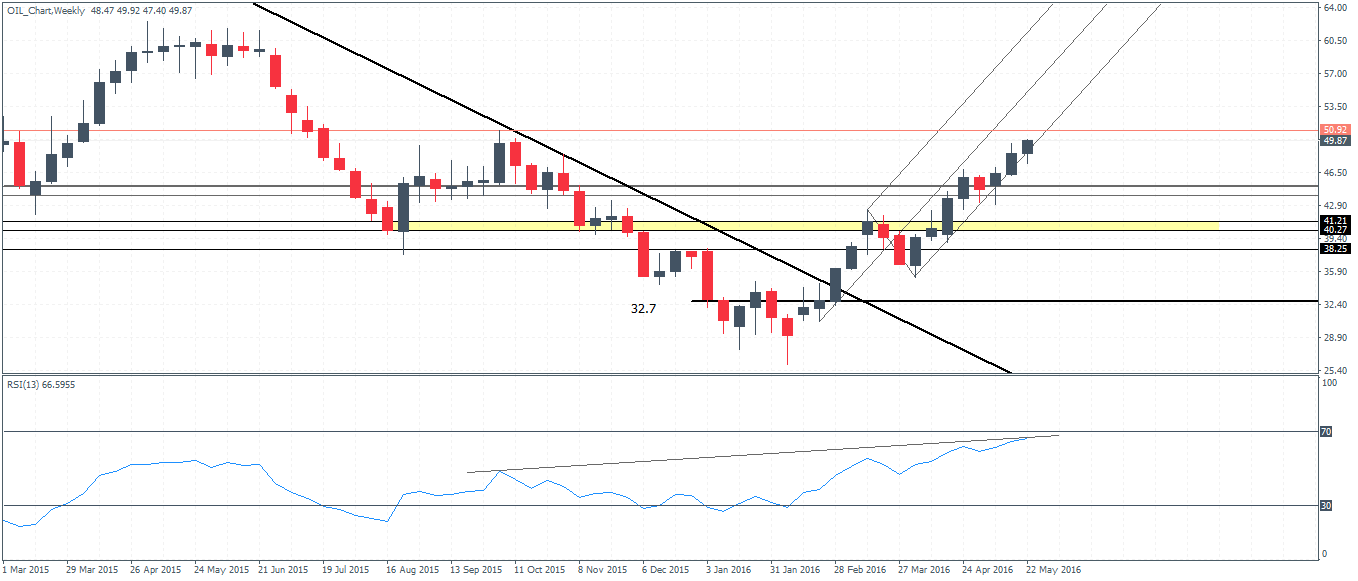
Crude Oil Weekly Chart (Continuous Contract, $49.87) – 26/05/2016
The daily chart shows the bullish momentum after the breakout from the bull flag’s consolidation. The minimum expected the target to the upside is towards $51.60, but for this, oil prices need to clear the $49.50 – $50 handle and possible pull back to establish support at this resistance level. Alternately, failure to break the resistance at $49.50 – $48.10 could see the bull flag pattern invalidated, which could see prices fall towards the next lower support at $44.50 – $44.0.
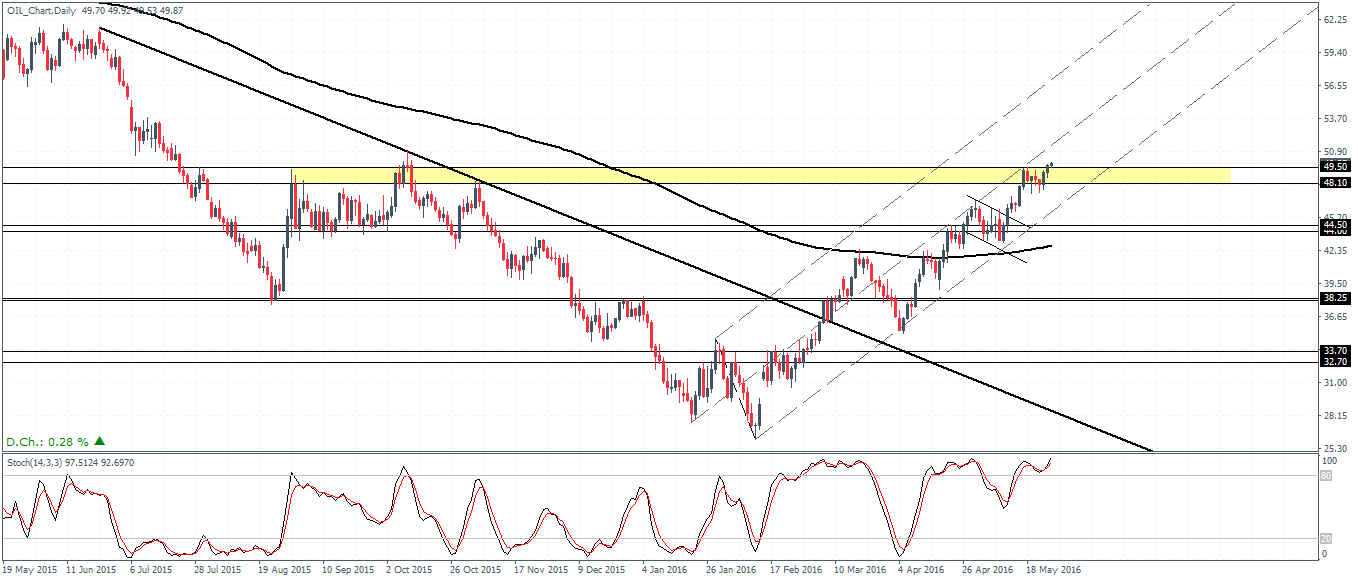
Crude Oil (Continuous Contract) – Daily Chart, Price at resistance

