
WTI Crude oil extended gains for a second day as a surprise drawdown in inventory sends Oil higher, closing at $46.35 on Wednesday, 11th May 2016.
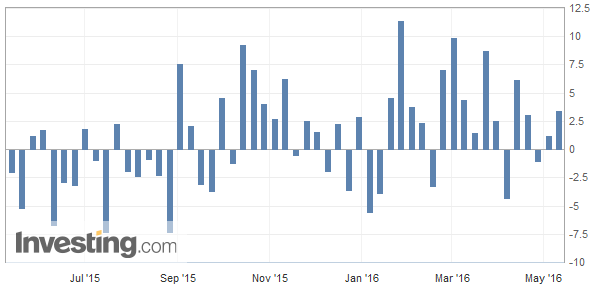
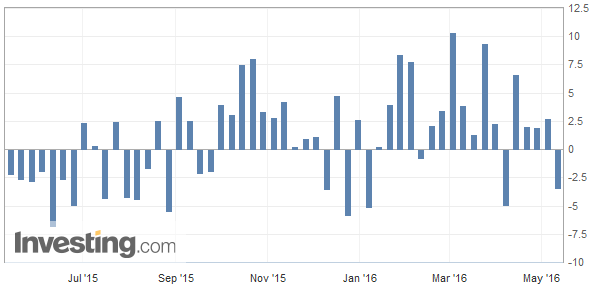
A surprise drawdown in the weekly US crude oil inventory report released by the EIA yesterday sent WTI Crude oil prices to fresh 2016 highs. Oil prices closed yesterday at $45.99 after the weekly inventory report by the US Energy Information Administration showed that the weekly inventories fell 3.4 million barrels for the week ending May 6, reversing the previous week’s 2.8 million barrels in the build-up. Analysts were expecting to see a 0.1 million build up in oil inventories. The EIA’s report was in sharp contrast to the American Petroleum Institute’s weekly inventory report which showed that for the same period, US crude oil inventories rose 3.45 million reaching a high of 543.1 million barrels for the week reported. This report beat expectations of a 714k build up instead.

Oil prices remained volatile for the most of the week with a lot of factors contributing to the volatile.
- Saudi Arabia replaced oil minister Ali al-Naimi who was in the position for nearly two decades with Mr. Falih, Chairman of Saudi Aramco
- Wildfires in Alberta, Canada disrupted productions at the Oil Sands supporting oil prices
- Iran production continued to increase by nearly 484k barrels per day
- Saudi Aramco is expected to increase production over the coming weeks adding more than 1 million barrels a day
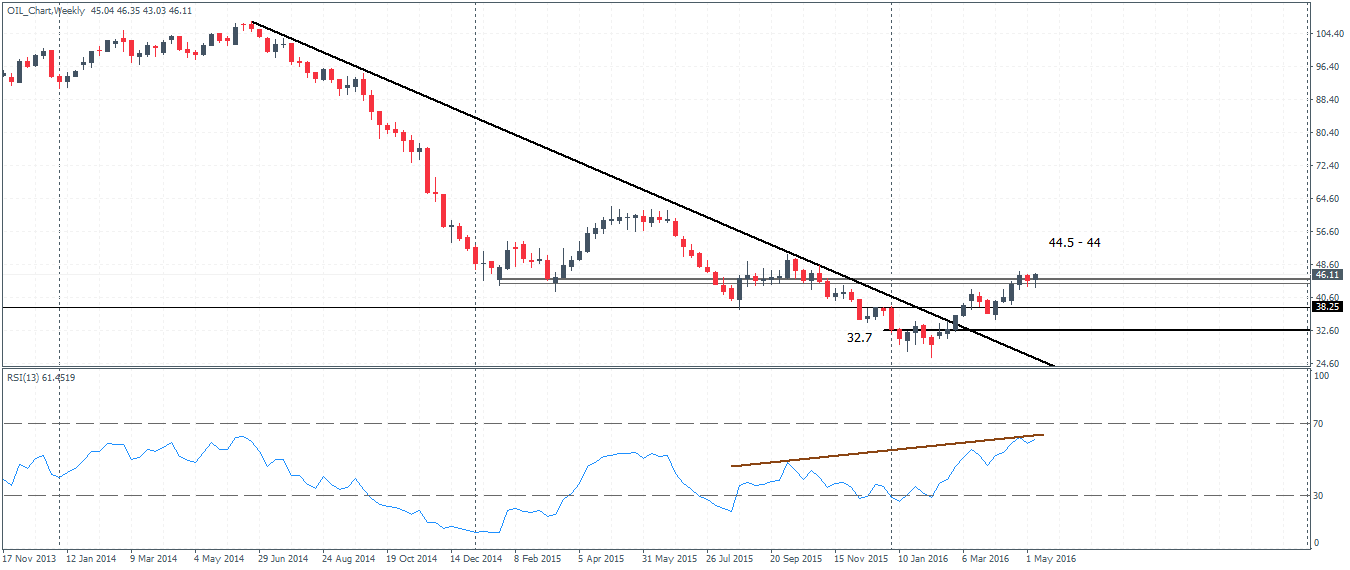
Crude Oil Technical Outlook
The weekly chart for Crude Oil shows prices struggling to break above the $45 handle on the weekly chart. Failure to post a convincing break above this level could spell downside risks with the price action continuing to show the hidden divergence. The support/resistance failure at 44.5 – 44 on the weekly chart could mean that Oil prices could eventually correct to 38.25 initially to find support.
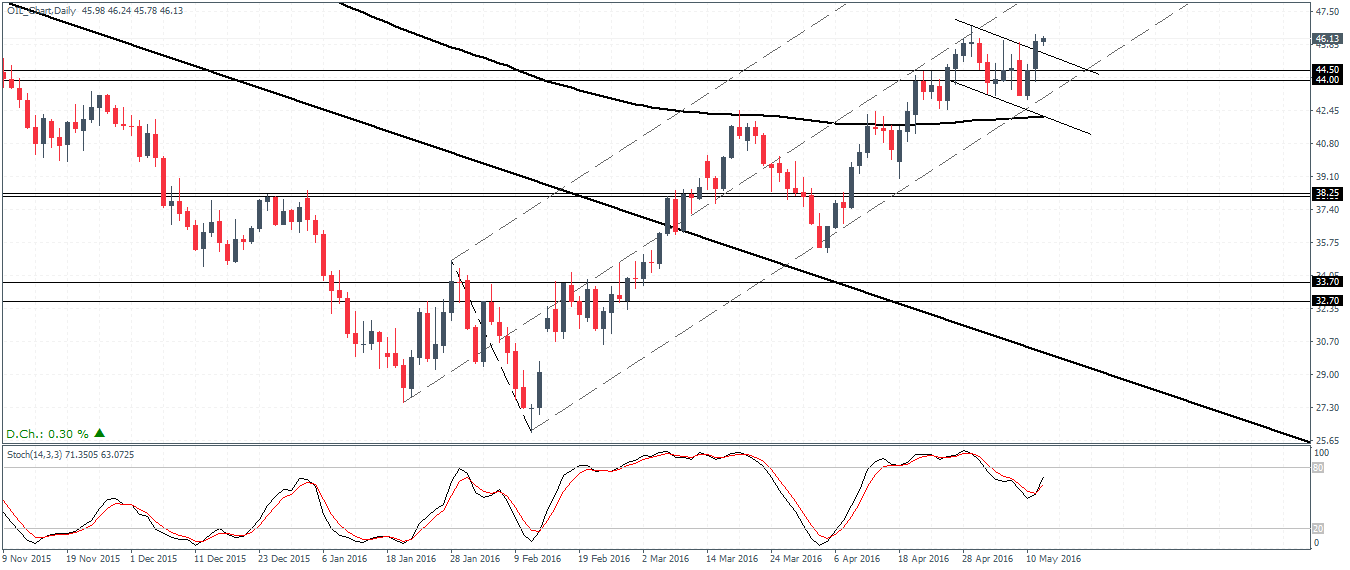
On the daily chart however price action is showing a bullish flag pattern currently, which is broken above the previous highs at 46.77, could start a new bullish rally in prices. The minimum price target on a bullish continuation from here could see oil test the $50 handle quite easily. But the Stochastics paints a different picture with a bearish divergence which could see the bullish flag pattern failing, in which case price action could fall to 38.25 initial support followed by 33.70 – 32.70 lower support.
On the 4-hour chart, resistance is seen near 46.77 – 46.55 while support is found at 43.56 – 43.22. Failure to close above the resistance and a bearish reversal pattern near this level could see some pullback, but the bullish bias remains intact until the main support at 43.56 – 43.22 is cleared.
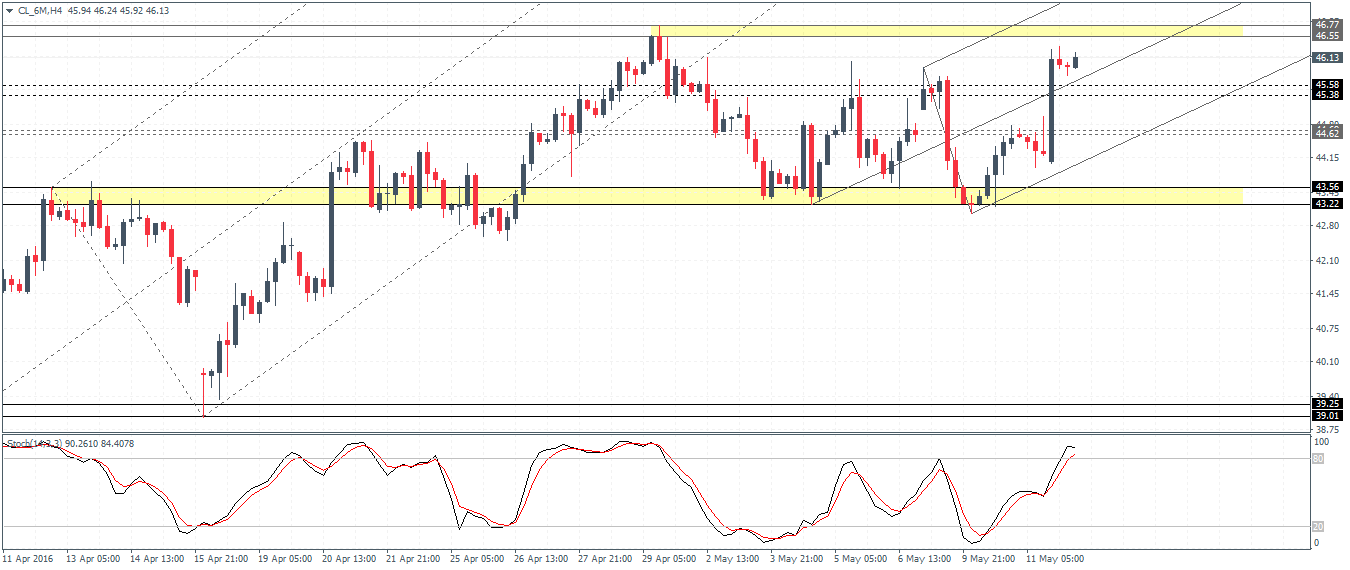
Overall, we expect oil prices to enter a period of consolidation near the current levels with further direction being established either on a breakout above 46.77 – 46.55 for a continuation to $50 and the downside, a break below the support near 43.56 – 43.22 will confirm a move to 39.25 – 39.0.

![Credit Card 160×600 [EN]](https://assets.iorbex.com/blog/wp-content/uploads/2023/06/13144507/Blog-Banner_EN-Banner_160X600X2.webp)