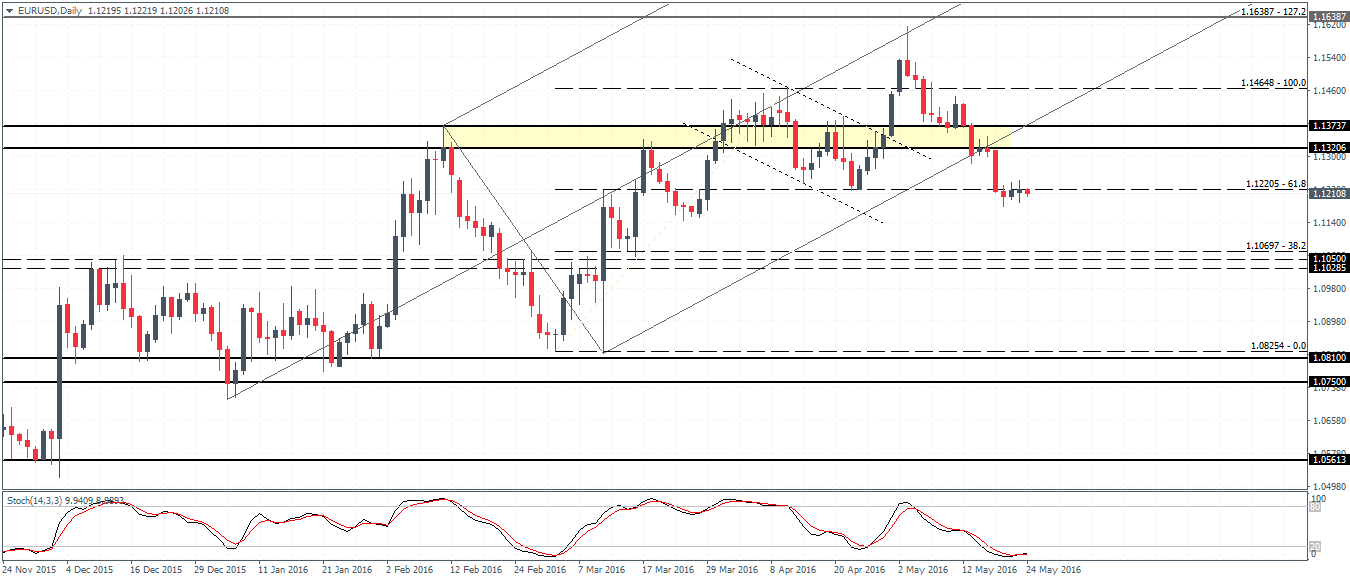
EURUSD (1.12) is moving in a clear downtrend with strong bearish declines followed by periods of flat price action. Currently, the support level at 1.120 – 1.1220 is seen to be holding the declines. The chart also shows a failed bullish flag pattern. The near term shows a possible correction to the bull flag’s breakout near 1.1373, which is also a resistance level. A lower high near 1.1373 – 1.40 will confirm the downside as EURUSD is likely to fall towards 1.107 – 1.10 support.
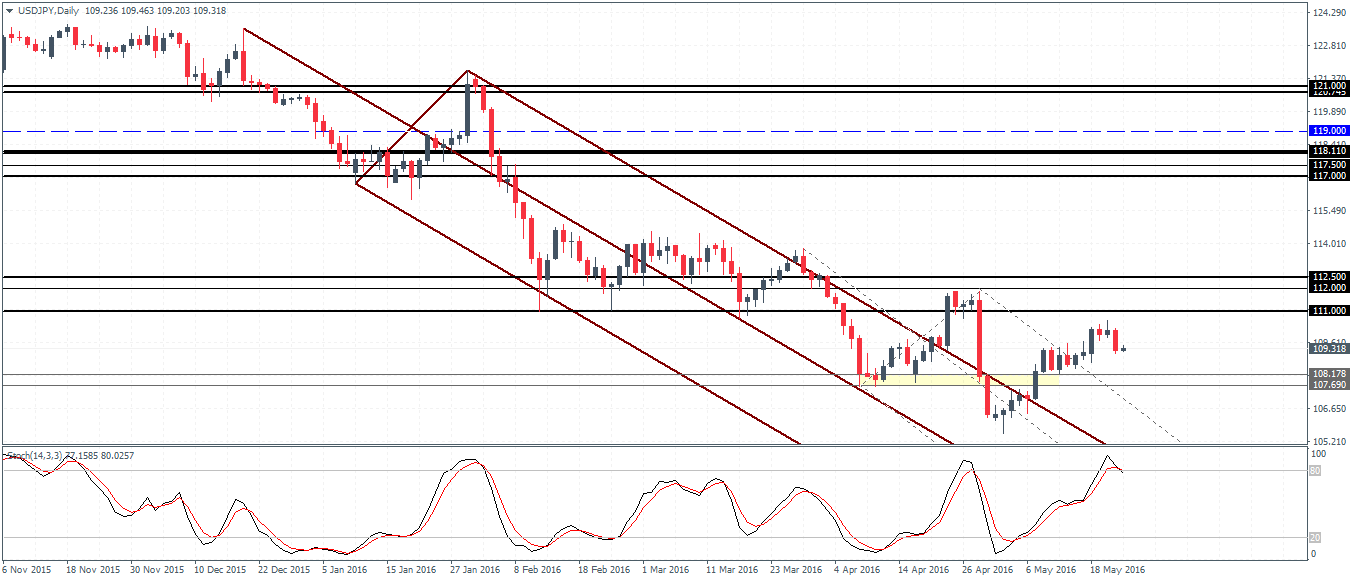
USDJPY (109.3) has been moving in a steady uptrend but with no test to the 108.180 – 107.70 broken resistance, a retest of this level of support is likely ahead of further upside. Resistance at 111.0 is the first level to watch for followed by 112.0 – 112.50 resistance. USDJPY price action is clearly indicating a move to the upside, and a rally above 112.50 will see further upside to 118.110.

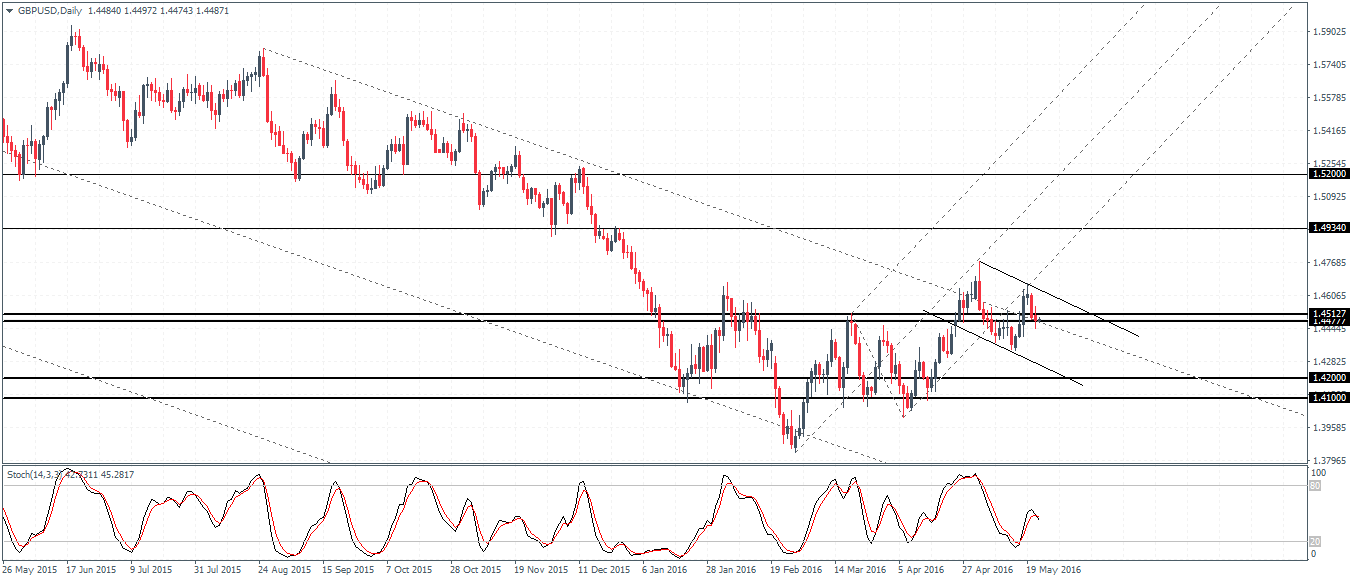
GBPUSD (1.44) continues to show bullish signs in price action. Besides the inverse head and shoulders pattern that was formed, there is also a possible bullish continuation flag pattern taking shape. With prices currently near 1.451 – 1.447 region, this support level is likely to be crucial. If prices bounce off the current support, GBPUSD could possibly push higher towards 1.4934. However, failure to establish support at 1.451 – 1.447 could see GBPUSD decline towards 1.42 – 1.410 lower support.
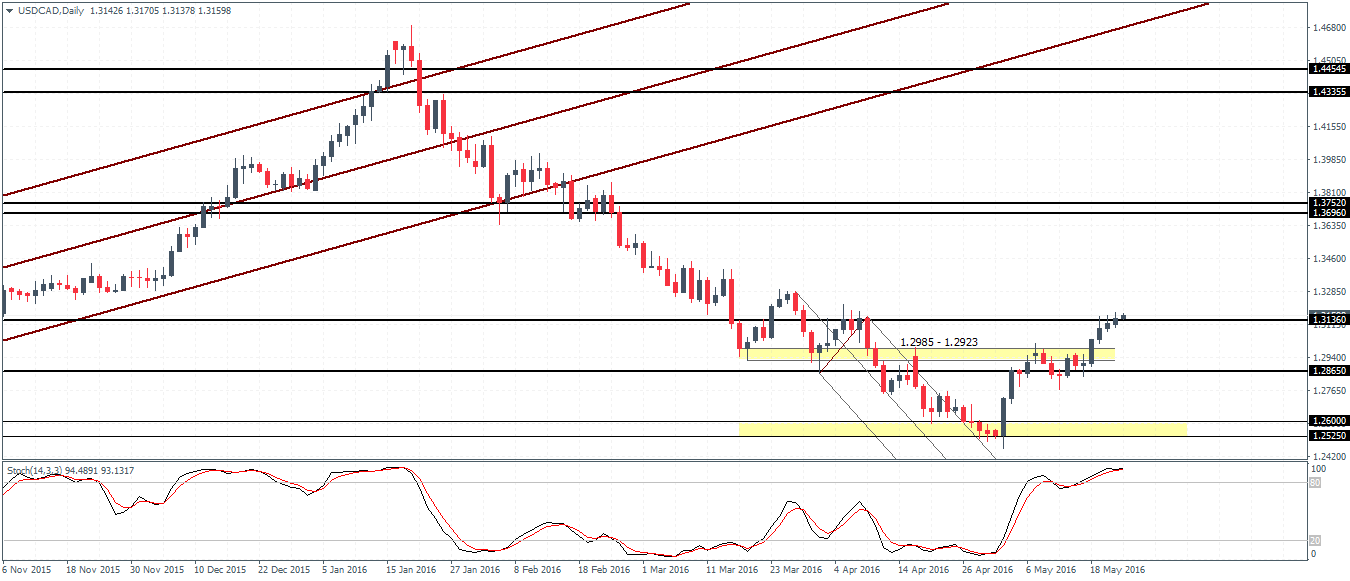
USDCAD (1.31) rallied quite strongly with no pullback to the 1.26 level after breaking out. The previous few sessions on the daily chart have seen prices moving in a small range near 1.3136 resistance. A break above this level could see USDCAD break higher to 1.3696 – 1.375 resistance. However, the hidden divergence at the current levels is more likely to see USDCAD pull back lower. Watch for support at 1.2865.
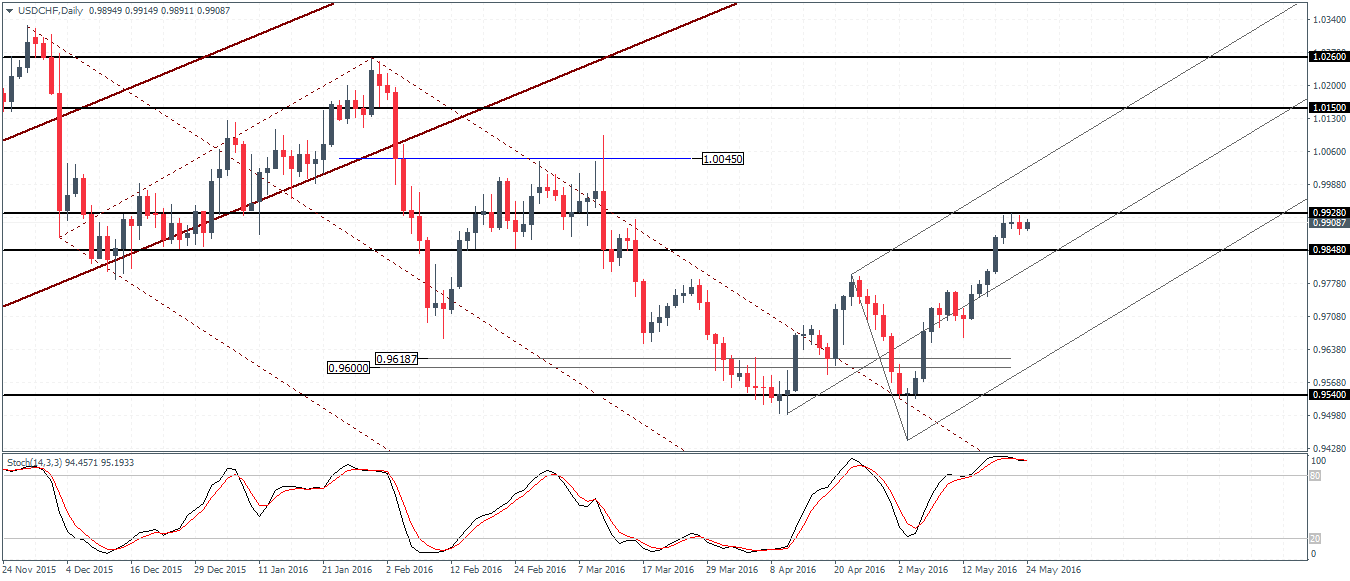
USDCHF (0.99) formed a doji three days ago, but price action has now followed through. The continued small range is likely to see a possible break of the range in the near term. Above 0.9928, we could expect a move to 1.0045 level of resistance. To the downside, 0.9848 support will be key to watch. A break below 0.9848 could see a move to 0.9778.