
EURUSD (1.126)
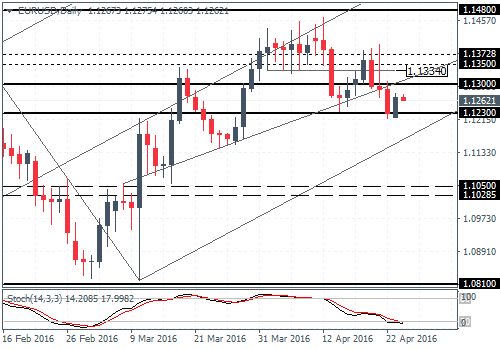
- EURUSD looking to retrace the losses following the head and shoulders formation and a break of the neckline support at 1.13 – 1.1334
- Strong resistance at 1.1372 – 1.135 indicating price action is limited to the upside, but a break of this resistance could see further gains
- A successful test of the neckline could see EURUSD fall towards 1.105 – 1.1028 lower support
- Support: 1.105 – 1.10285; Resistance: 1.1372 – 1.135
USDJPY (111.07)

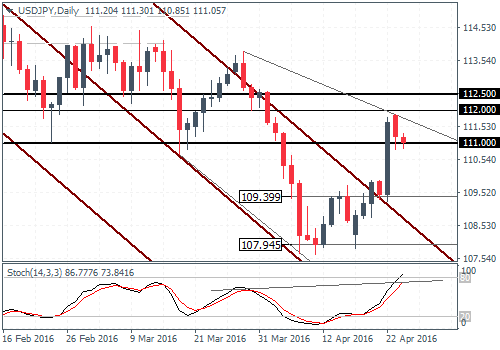
- Hidden divergence on chart indicates a short-term decline to 109 levels
- Potential support could be tested near 109.4 – 109.5 levels in the near term
- Downside is limited, but a close below 109.4 could see USDJPY trade sideways within 107.95 lower support
- A potential higher low could be forming, which would confirm the bullish breakout from the median line, eventually targeting 117
- Support: 109.4 – 109.5; Resistance: 112.5 – 112
GBPUSD (1.449)
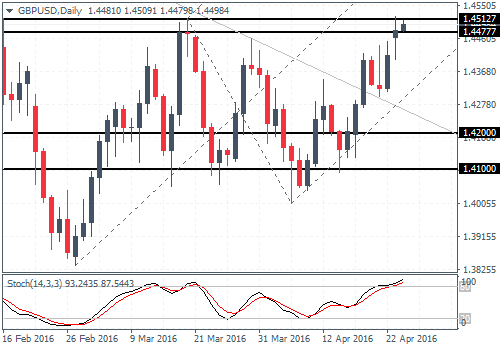
- Price action trading at the neckline resistance of the inverse head and shoulders pattern of 1.451 – 1.447
- A breakout above this resistance could see further upside towards 1.489 and 1.50
- There is minor possibility for a dip to 1.42, but the bias remains to the upside as long as the right shoulder’s low near 1.406 is not breached
- Support: 1.42; Resistance: 1.451 – 1.447
USDCAD (1.267)
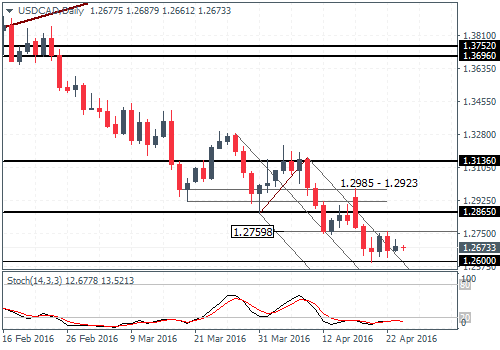
- 26 support is likely to hold, but USDCAD could dip lower to test this level with closing prices
- Price action is likely caught within 1.276 and 1.26 in the near term, but a breakout is imminent
- The bias is likely to the upside but needs confirmation on a close above 1.2865
- Price action on the daily chart remains inconclusive, but a recovery to the long-term declines is likely to support the upside bias in the near term
- Support: 1.26; Resistance: 1.276
USDCHF (0.975)
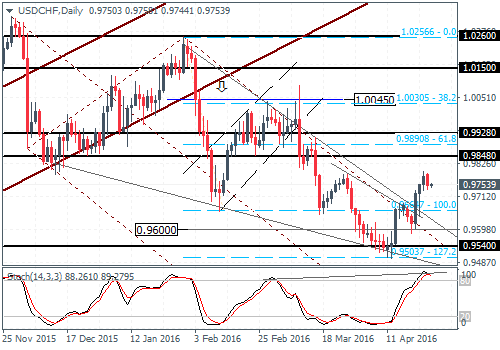
- The breakout to the upside following the descending wedge pattern indicates a near-term strength in USDCHF
- Price action is currently forming a hidden divergence and a retest to 0.966 is likely which marks the breakout from the descending wedge pattern
- Upside correction in USDCHF could see resistance at 0.9928 – 0.9848 holding the gains, but a break above this level could see USDCHF move to 1.0045
- Support: 0.9664 – 0.96; Resistance: 0.9848 – 0.9928

