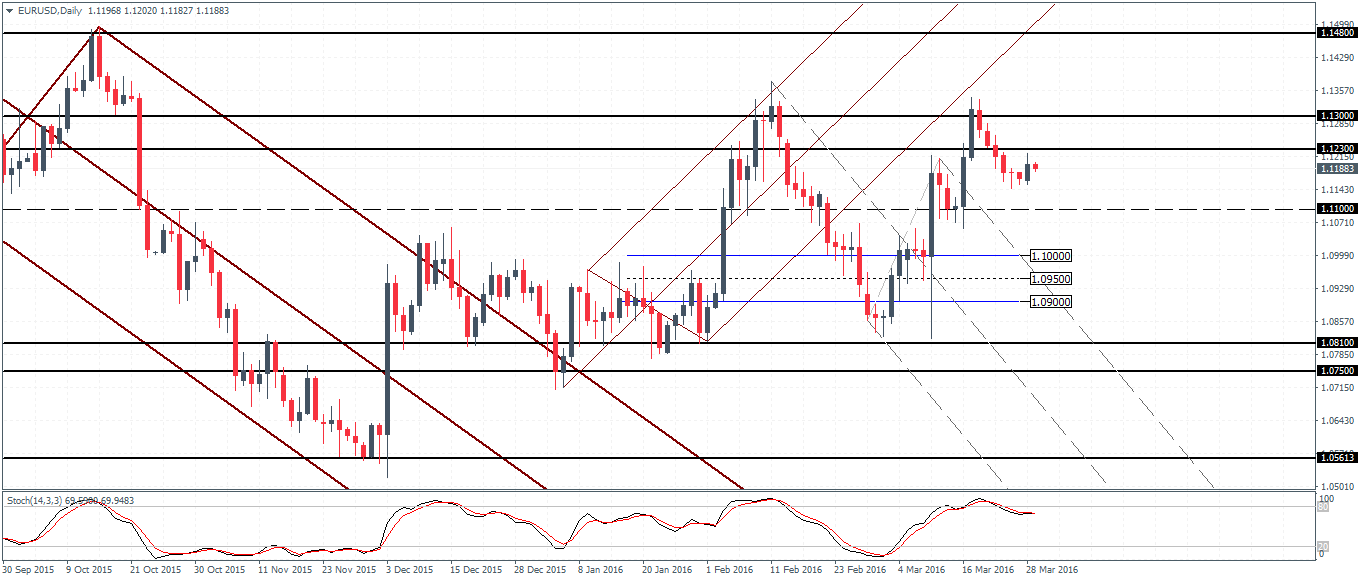
EURUSD (1.118): EURUSD is looking to retrace the declines over the past week after forming a bullish engulfing pattern on the daily chart yesterday (28/03). Price action remains below the resistance level of 1.13 – 1.123, so the immediate upside remains capped near 1.123. A break above 1.123 could see a potential rally back to the 1.130 level of previous resistance. But overall, the upside remains limited, unless there is a convincing break above the 1.130 resistance high, in which case, EURUSD could see further gains to 1.148. To the downside, 1.110 support will be tested, a break below could see a move to 1.10.
- Bias (D1): Downside
- Support: 1.11
- Resistance: 1.13 – 1.123
- Technical Forecast: A close above 1.123 could see EURUSD range sideways to 1.13, but upside remains capped, leaving prices vulnerable towards 1.110
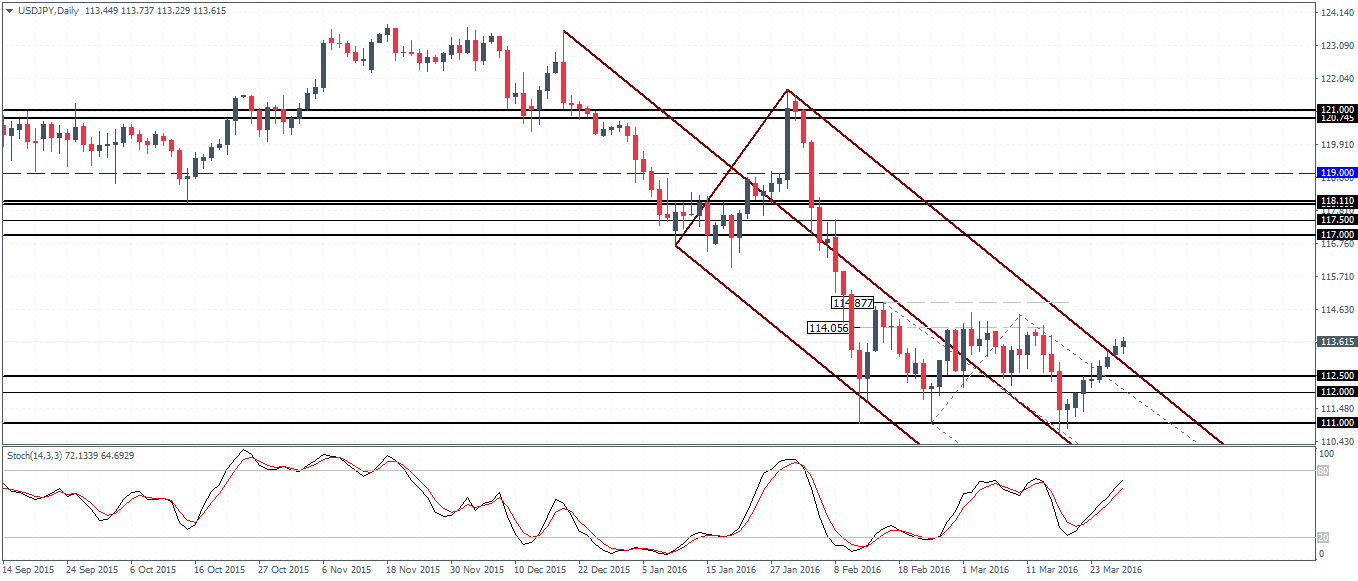
USDJPY (113.61): USDJPY continues its strong and gradual move to the upside, but prices are reaching the resistance level near 114.056 – 114.877. The daily Stochastics continues to point to the hidden bearish divergence towards the support near 112.5 – 112.0. Establishing support here could see a potential base being formed, in which case prices could eventually move higher. There is also a possibility of an inverse head and shoulders pattern being formed with the neckline resistance near 114.0 – 114.50 levels. A test to this level and a dip to 112.5 – 112.0 would form the right shoulder. If this pattern unfolds as expected, a break above 114.5 could see USDJPY rally towards 117 resistance for a much-needed retest.

- Bias (D1): Upside
- Support: 112.5 – 112.0
- Resistance: 114.0 – 114.5
- Technical Forecast: Watch a potential inverse head and shoulders unfolding if prices dip to 112.5 – 112.0, which could see USDJPY breakout and test 117
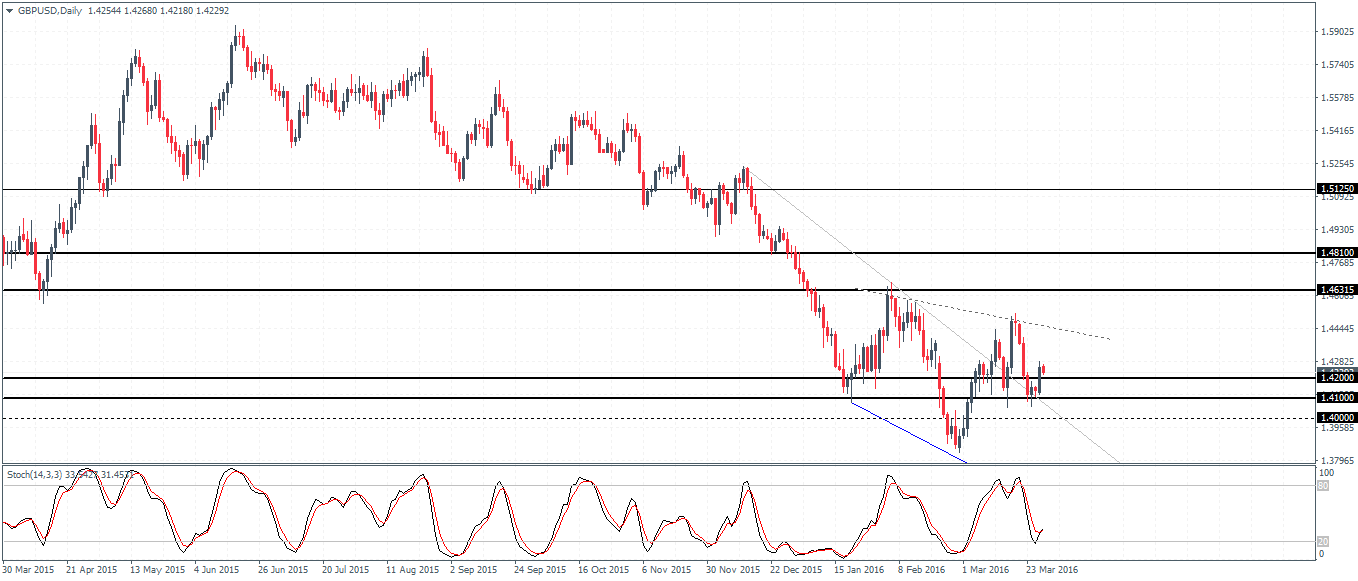
GBPUSD (1.422): GBPUSD is attempting to recover some of the lost ground following the bullish engulfing pattern formed yesterday (28/03). Price action remains supported near the 1.42 – 1.410 levels thus capping the downside. It is also very likely that an inverse head and shoulders pattern is taking shape, provided GBPUSD does not fall below 1.41. A retest to the slanting neckline resistance near 1.4445 could see an upside breakout, which will be immediately capped near 1.4631 – 1.481 resistance, but above this level, a test to 1.50 cannot be ruled out. A break below 1.41 of course invalidates the upside bias.
- Bias (D1): Downside
- Support: 1.42 – 1.41
- Resistance: 1.4445 – 1.45
- Technical Forecast: Watch for a potential inverse head and shoulders pattern forming, which will see an initial rally to 1.45, followed by a test of resistance to 1.4631.
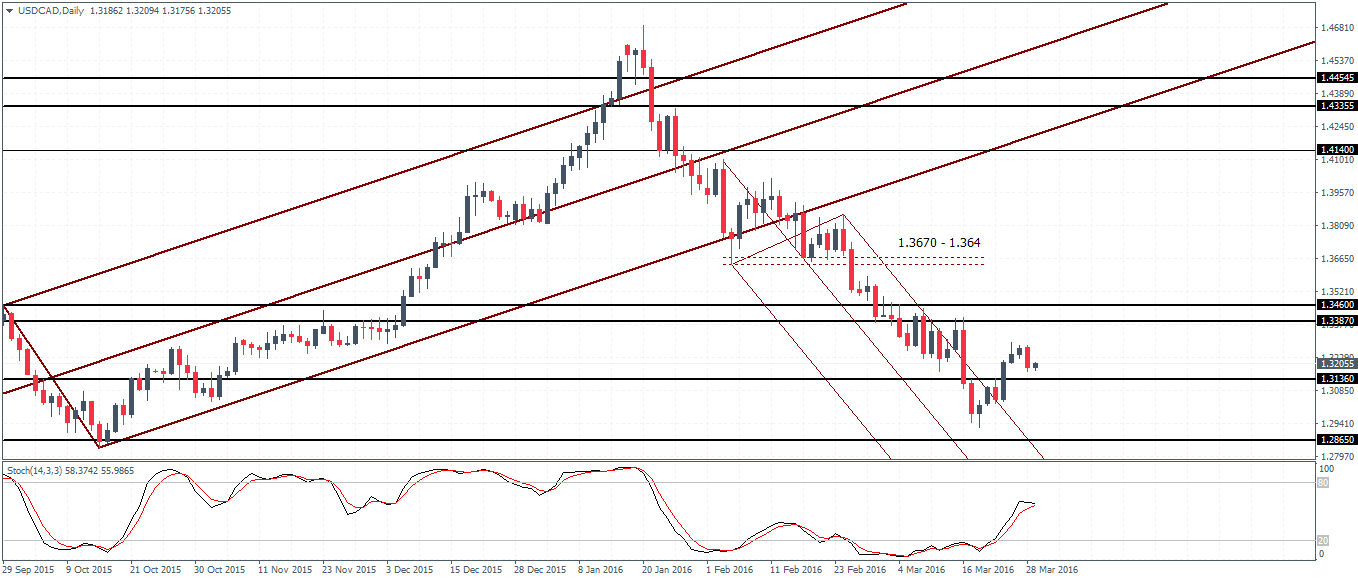
USDCAD (1.32): USDCAD has formed a bearish engulfing pattern yesterday indicating a downside correction. Support at 1.3136 – 1.31 will be the likely level to be tested. This could potentially form a higher low, in which case USDCAD will see an eventual rally to 1.3387 – 1.346. Above this resistance, 1.367 – 1.364 comes into the picture. Alternately, a close below the previous low could keep the downside bias intact.
- Bias (D1): Downside
- Support: 1.3136 – 1.31
- Resistance: 1.346 – 1.3387
- Technical Forecast: Prices could correct the downside in the near term if USDCAD establishes support near 1.3136 – 1.310
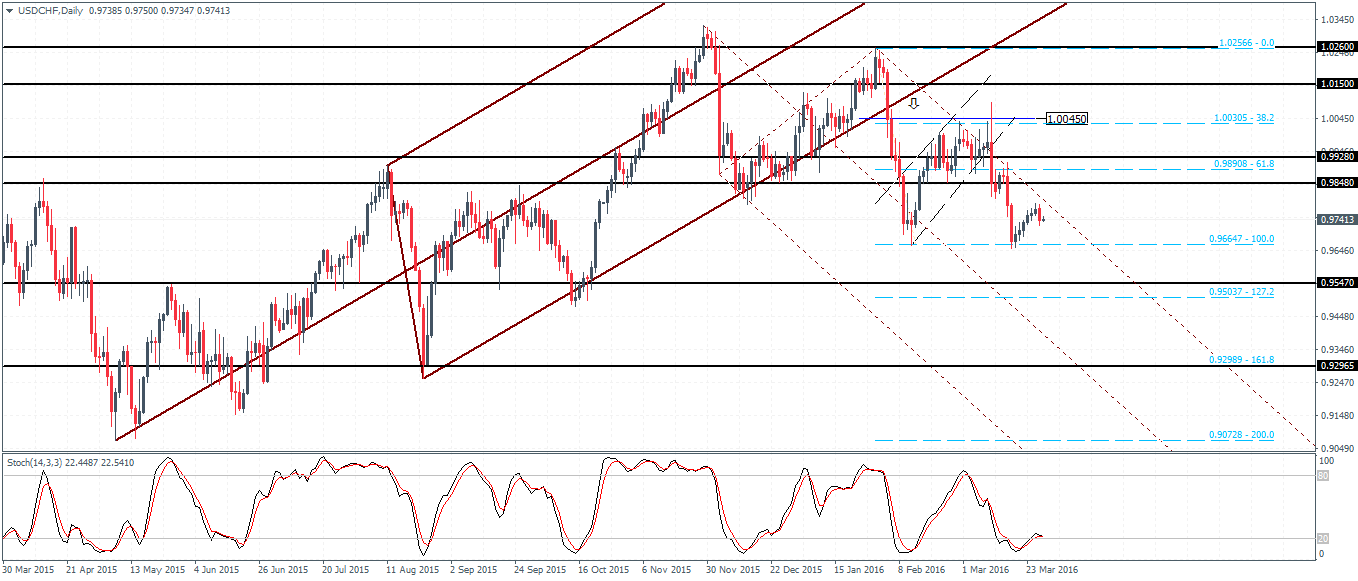
USDCHF (0.974): USDCHF retraced some of the losses but has turned lower on the bearish engulfing. A decline back to the previous lows near 0.9664 is, therefore, likely. A break below this low could see USDCHF post further declines towards 0.9457 support. To the upside, a breakout from the falling median line could see USDCHF target 0.9848 – 0.9928 resistance. Watch the daily Stochastics, which is forming a bullish divergence.
- Bias (D1): Downside
- Support: 0.9664
- Resistance: 0.9848
- Technical Forecast: Potential bullish divergence points to a correction towards 0.9848 resistance if support at 0.9664 holds