The precious metals are likely to see another week closing out with prices settling higher in the longer term. On a week to date basis, Gold prices have lost -1.83% while Silver is down -1.45%. Yesterday’s terror attacks in Brussels saw investors bid up the safe-haven Gold sending prices back above the $1250 handle and it is likely that Gold prices will settle another week, (four) near this level. However, there are quite a few reasons which show that the upside momentum is Gold is slowly losing its steam and unless there is a pullback with support being established at one of the lower levels, the upside rally is could become hard to justify. Silver prices, on the other hand, have formed an interesting higher low in the charts and could be biased for a further upside move.
Gold – Technical Outlook
The weekly chart for Gold shows prices staying range bound after briefly touching the resistance level noted near $1275 – $1284 levels. Currently, the weekly charts do not show any conclusive evidence of a move to the downside, with the exception of the reversal pattern with lower highs being formed following a test to 1283.65 in the week of 6th March 2016. The $1250 handle is likely to see more consolidation if prices fail to break the trend line.
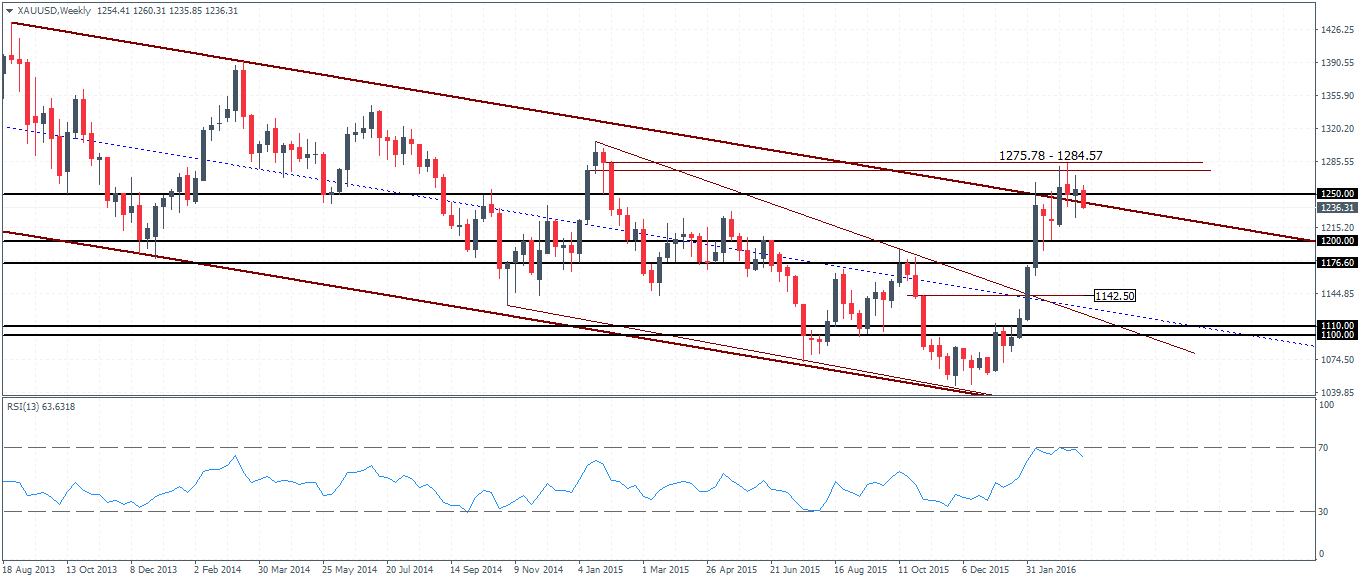

Also, adding to this slightly bearish view is the fact that the 13 periods RSI has currently printed a higher high in comparison to the lower high at the current levels, relative to the highs at $1307 formed in the week of 18th January 2015.
On the daily chart, while the rising wedge pattern has been broken and retested, the consolidation at $1250 remains a bit frustrating. However, prices haven’t created any higher high which is indicative that a move to the downside is possible, with $1200 turning out to be a key level of interest.
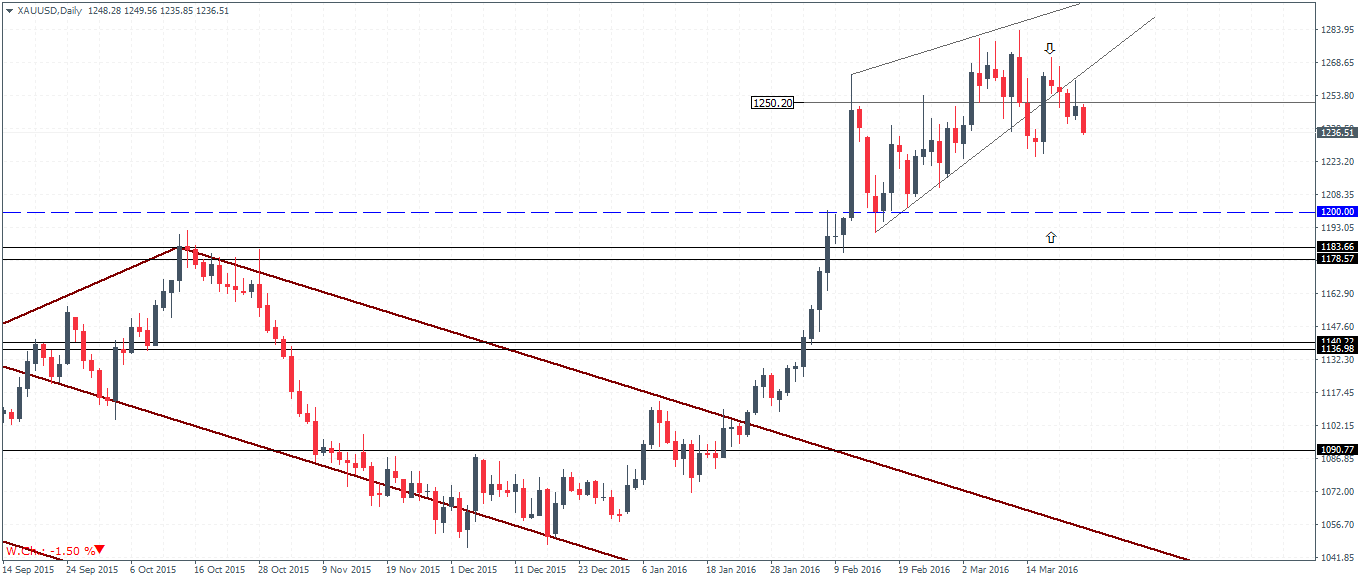
To conclude, Gold’s rally is certainly looking weaker with the failure to post new highs while prices stay consolidated near the $1250 handle. As such, a decline to $1200 levels to establish support is required.
Silver – Technical Outlook
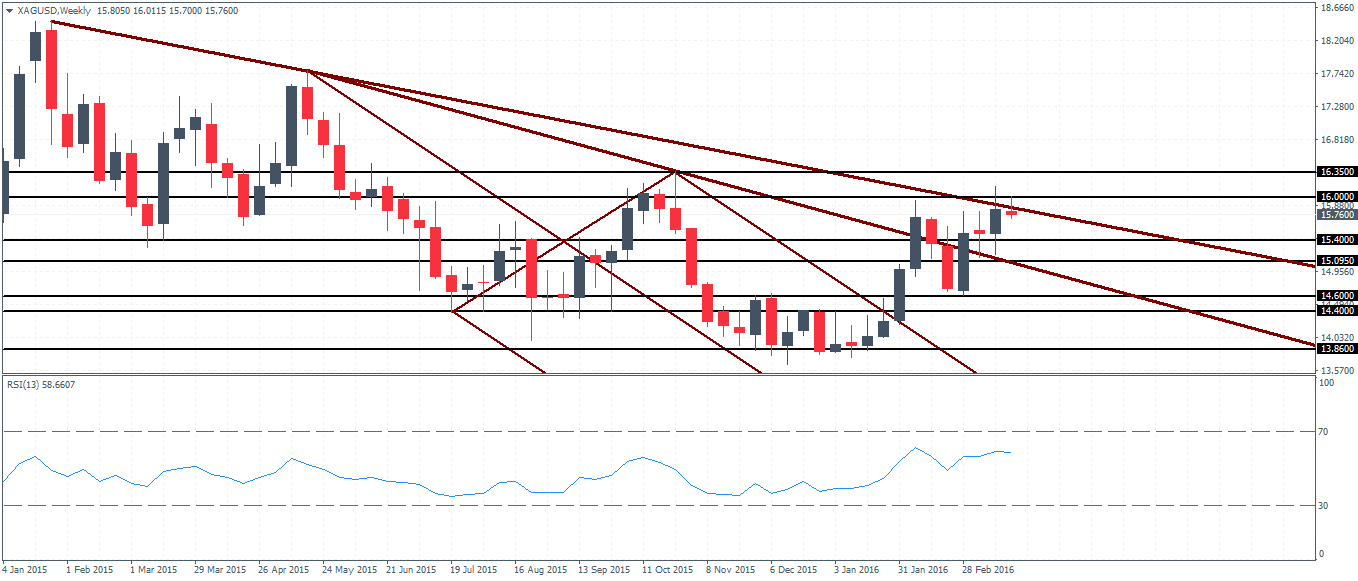
The weekly chart for Silver shows prices forming a higher low above the $14.60 – $14.40 handle, which comes off the previous lower low and a base formed at the $13.86 handle. However, Silver prices are not entirely out of the woods yet as price needs to break above the previous high formed at $16.35 – $16.0 resistance. A successful break above this level could then potentially pave the way for a test to $17.5 levels, previously established in the week of 10th May 2015. However, caution needs to be applied to the 13 period RSI for Silver shows a hidden bearish divergence with the oscillator posting highs against price’s lower highs.
On the daily chart, prices are back near the resistance level of $16.0 and $15.70 and further upside is likely only on a break above this resistance level. The minor median line plotted on the most recent price action could, however, signal any potential downside, a breakout from the lower median line could see Silver likely to us lower to the $15.27 region and at $14.72 – $14.65 level further down.
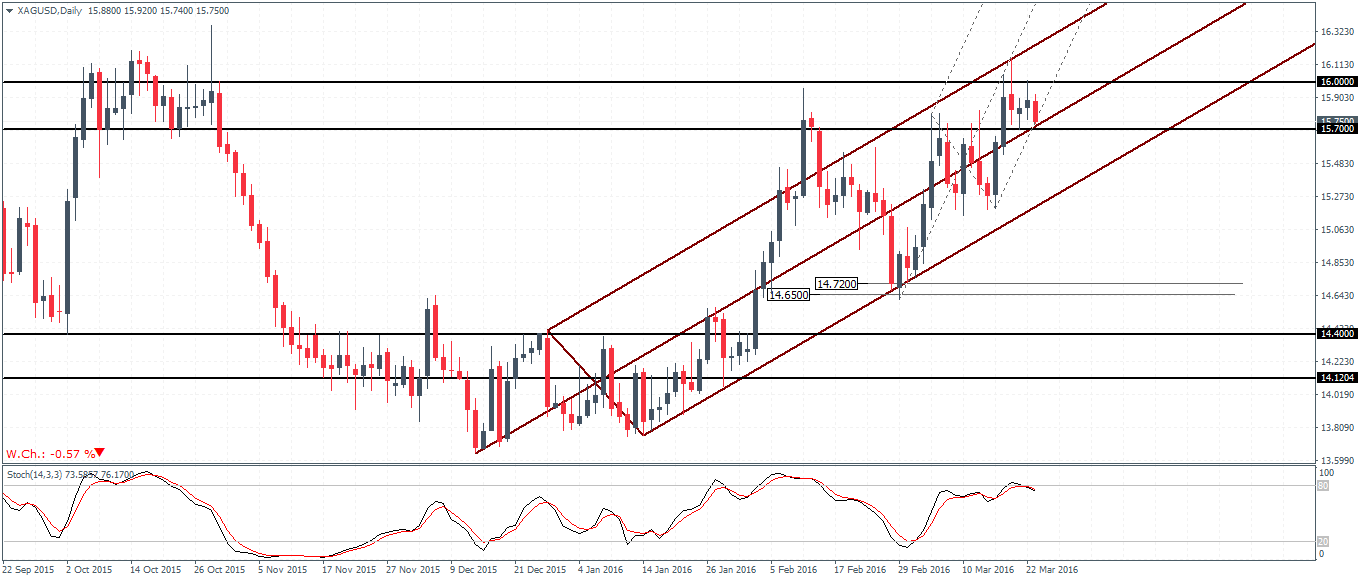
In conclusion, watch Silver prices for a potential breakout to the upside above the $16.0 handle. A possible break to the downside below $15.70 could see a Silver decline to $15.27 and even possibly lower to $14.72 – $14.65.

![Credit Card 160×600 [EN]](https://assets.iorbex.com/blog/wp-content/uploads/2023/06/13144507/Blog-Banner_EN-Banner_160X600X2.webp)