
The rally in Gold continues to outperform despite equity markets recovering from declines in Jan/Feb. With the ECB decision due on Thursday, Gold could remain range bound in anticipation of further QE announcement.
The precious metals continue to perform strongly in a rally that clearly looks overextended and despite the equity markets regaining the lost ground, Gold has remained resilient. Trying to catch a top in these strong trends is likely to be a risky bet at least for Gold. Last week, Gold prices gained 3.06% posting a 13-month high to $1279.65 while Silver gained 5.57% completely reversing the previous week’s declines. Silver, however, has failed to post new highs indicative of losing exhaustion or at the very least another pullback lower.
Both the metals rallied strongly despite last Friday’s Nonfarm payrolls posting a higher than forecasted jobs print. However, given the mixed nature of the report and the fact that futures markets are pricing in no rate hike in March, Gold remains well supported at this juncture. In anticipation of the ECB’s monetary policy meeting tomorrow and mounting expectations of further monetary policy easing, Gold prices could remain strong with a bias to the upside remaining. Expanding more QE could be positive for Gold, at least in terms of the Euro.
Earlier this week, Goldman Sachs released a note stating that the commodity rally is likely to fizzle sooner than later giving a short term target for Gold at $1100, recommending to short gold.

Gold – Technical Outlook
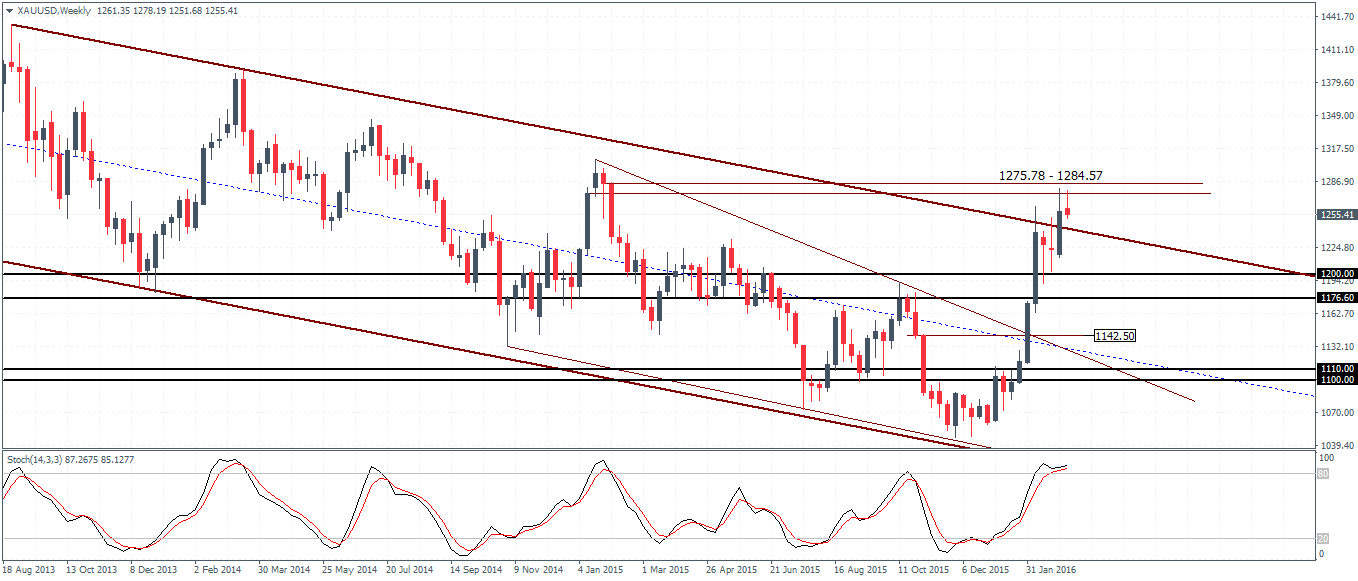
Following the doji candlestick pattern on the week of 21st February, we expected to see a move to the downside if prices broke below the doji’s low at 1202, which didn’t happen. The resumption of the upside momentum saw prices briefly testing the 1275 – 1284 resistance level which we noted. A firm test (closing prices) near this resistance level could be an initial indication that a correction is likely to happen in the near term, but one which needs to be substantiated with further candlestick patterns.
On the daily time frame, the rising wedge pattern is standing out clearly showing the extent of the price action. 1250.20 is the key level to watch which could act as support for any moves to the downside. However, a break below this key level and after seeing how the ECB announces its policy this week, a break below 1250 could see a strong move to the downside. Support at 1183 – 1180 is the first level of interest which could keep Gold biased to the upside and could risk another rally to post a lower high. Only a break below 1180 will see a test to the next support at 1140 – 1138 region.
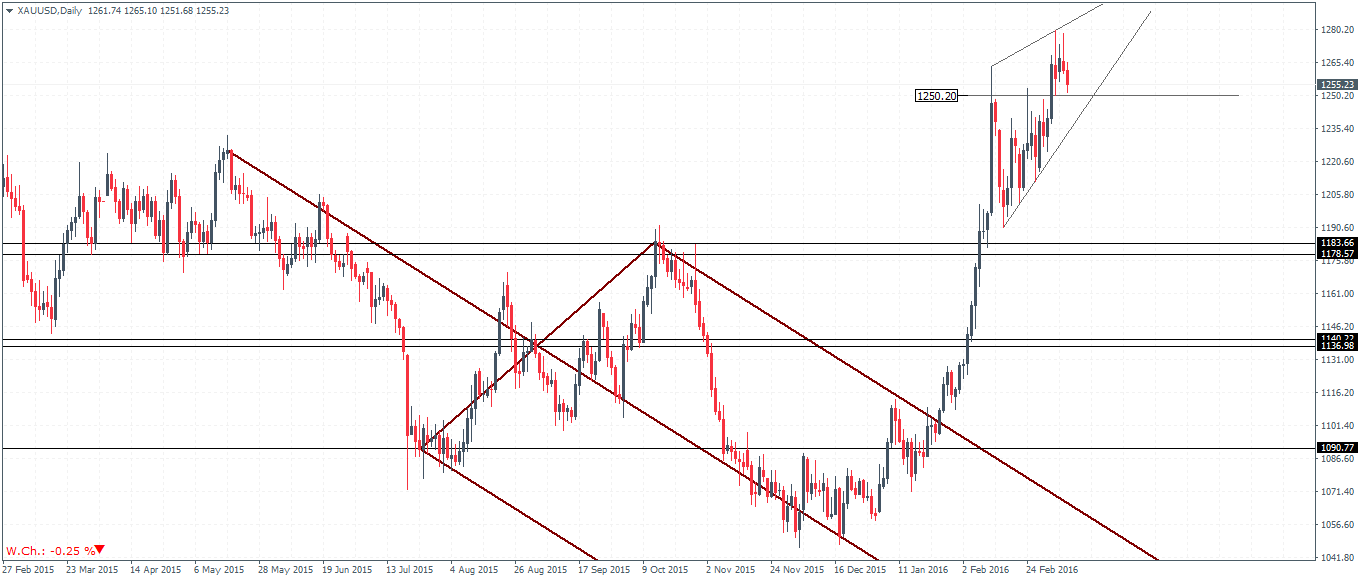
In conclusion, Gold prices could remain range bound into ECB’s meeting. Announcing further QE expansion could be seen a positive for Gold which should see prices remain well supported above the $1250 handle.
Silver – Technical Outlook
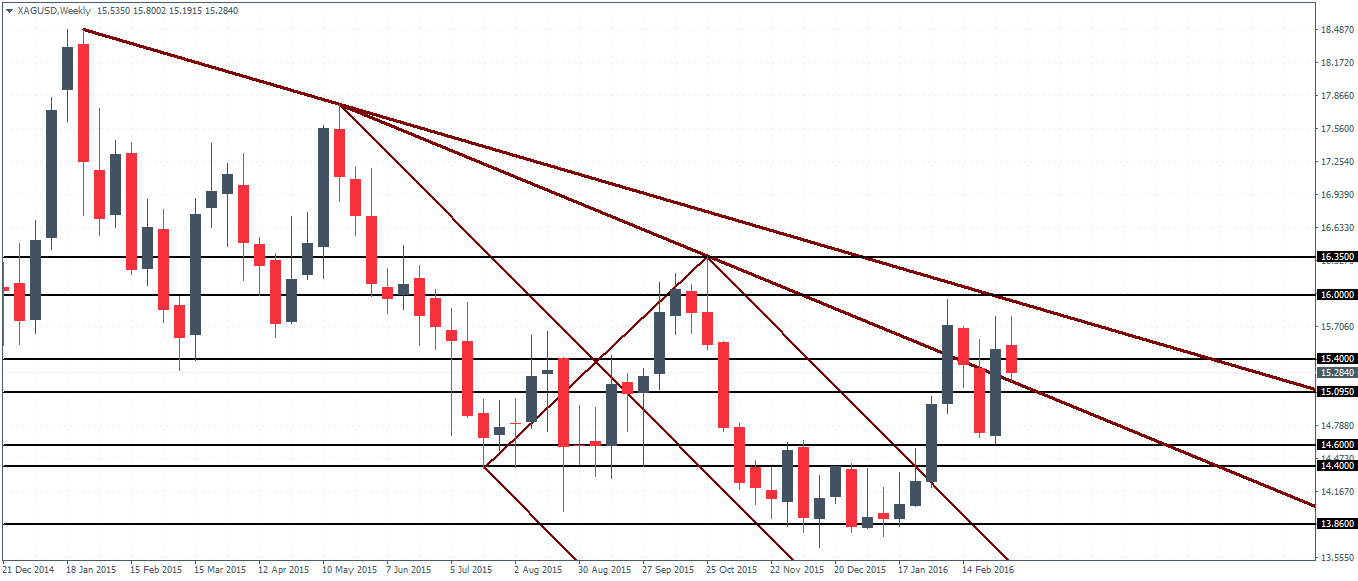
The weekly chart for Silver has seen a strong rebound last week. Prices have in fact closed on a bullish engulfing pattern just above the $14.60 support level. The upside remains biased as long as $15.4 – $15 levels of support remain in play.
On the daily chart time frame, Silver prices have repeatedly failed to close above 15.70 resistance level which we noted last week. Combined with the previous high above 15.90, the current high above 15.7 has formed a lower high which could see a possible decline in the short term. The Stochastics oscillator continues to print the bearish divergence, failing to confirm the highs in prices. In the event of a move lower, support comes in at 14.40 – 14.50 region, which could see the weekly chart’s bullish engulfing failing to signal the move to the upside.
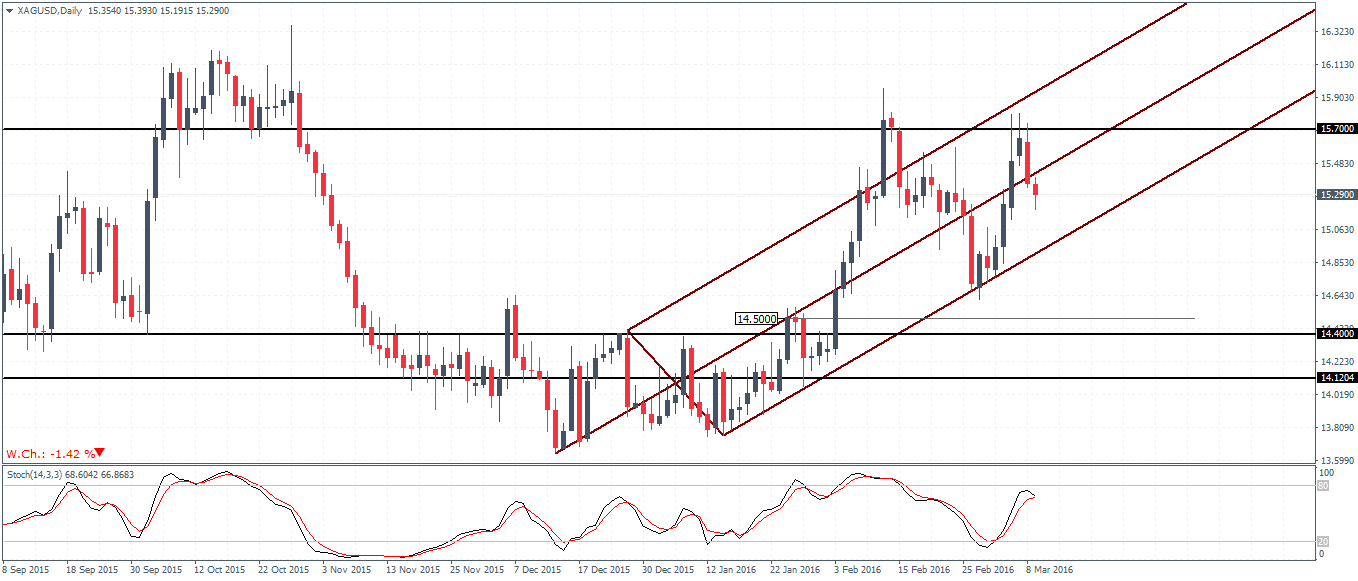
In conclusion, Silver prices could remain range bound and in the event of a move lower to $14.40 – $14.50 the weekly chart’s bullish engulfing pattern could be at risk. In the near term, Silver is likely to remain flat on a weekly time frame.

