Gold-Silver ratio, Gold/Silver or Gold-to-Silver ratio measures the amount of Silver required to purchase one ounce of Gold. Gold-Silver ratio had been in use since the 1970’s when the United States fixed the ratio to 15:1; meaning that 15 troy ounces of Silver were required to purchase one ounce of Gold.
The Gold-to-Silver ratio is widely used among the investing community and is one of the many ways to determine whether Gold or Silver is overpriced. The Gold/Silver ratio helps traders in timing their trades on either Gold or Silver spot or futures contracts. A widely accepted principle, using the Gold/Silver ratio is that when the ratio is at the higher end of the scale, it shows that Silver is underpriced in relation to Gold and thus warrants that Gold will underperform Silver. Similarly, when Gold/Silver ratio is at the lower end of the scale, it shows that Gold is underpriced to Silver indicating that it is a good time to buy Gold in relation to Silver.
Gold-Silver ratio – How are prices derived?
Obvious from the name “Gold-Silver” ratio, it is nothing but a ratio chart between Gold and Silver. Just as one would use a simple currency pair to trade, such as EUR/USD, so it is the same with the Gold/Silver ratio. With currencies, you are merely buying or selling one currency relative to the other. Therefore, if you believed that EUR was under performing, you could buy EUR and sell USD, or vice versa.

The calculation of the Gold-Silver ratio is:
Current Gold Price / Current Silver Price = Ratio
If Gold was currently trading at $1200 and Silver was trading at $15, then the Gold/Silver ratio would be 1200/15 = 80
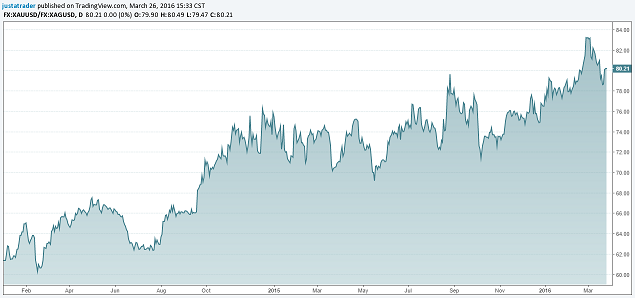
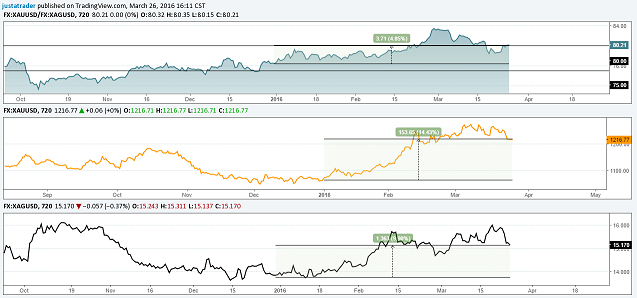
There are much Bullion related websites that offer an up to date Gold/Silver ratio, but you can construction your own as well. The chart below shows an updated Gold/Silver ratio which is currently at $80.21
How to use the Gold/Silver Ratio Chart?
When using the Gold Silver chart, most traders confuse this as a way to buy or sell Gold or Silver. But this is not how it works. The following chart below shows the Gold/Silver ratio chart followed by the individual Gold and Silver charts.
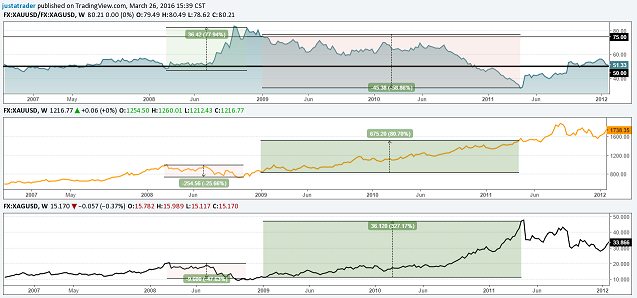
It should be obvious by the chart above as to the use of Gold/Silver chart. This is evident in the Gold/Silver ratio’s rally off 50 to the 75 level meaning that Gold would outperform Silver. Between these periods, both Gold and Silver fell. But Gold’s decline was lesser than that of Silver. Gold lost -25.66%, while Silver’s losses were bigger, -47.6%.
After the Gold/Silver ratio had peaked above 75, it started to decline, meaning that Silver would outperform Gold. The following periods of decline in the Gold/Silver ratio, Gold rallied 80.70%, while Silver gained 327.17%.
As you can realize, the Gold/Silver chart is a tool which helps you to allocate your portfolio into either Gold or Silver. It does not tell you whether Gold or Silver or both will rally or not. This is subject to the individual analysis of both the metals in question.
What is the current state of the Gold/Silver ratio?
Analyzing the current state of the Gold/Silver ratio, we notice that the ratio has been in a steady uptrend, rising from the 50 level and currently back above the 75 level. We now know that Gold was outperforming Silver since late 2011. Indeed, Gold prices fell only -30.57% in the period, while Silver lost -57.02% in the periods.
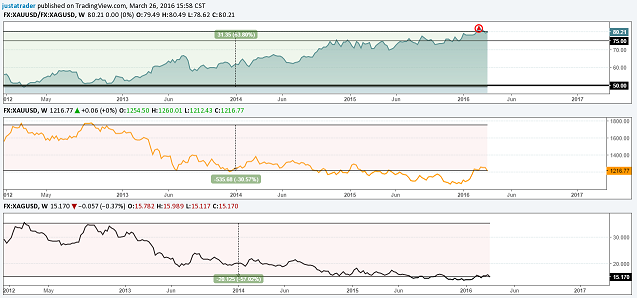
Moving to a mover shorter time frame and applying the Gold/Silver ratio since 2016 January, you can see that the ratio chart has been moving higher between 75 and 80. It is obvious from the chart that Gold was to outperform Silver, which was the case. On a year to date basis, Gold has gained 14.46%, compared to Silver’s 9.90% return.
Looking ahead, if the Gold/Silver ratio starts to fall from the current levels moving back to 50, we can deduce that Silver will outperform Gold. In other words, if the precious metals resume their bearish trend, Silver’s losses will be lesser than Gold, or if the precious metals continue to move higher, Silver’s gains will surpass that of Gold.
For traders who have a special interest in trading the precious metals or their relative assets such as mining stocks or ETF’s the Gold/Silver ratio can be a very helpful tool for understanding which of the two metals are more likely to yield bigger returns in relation to the other.

