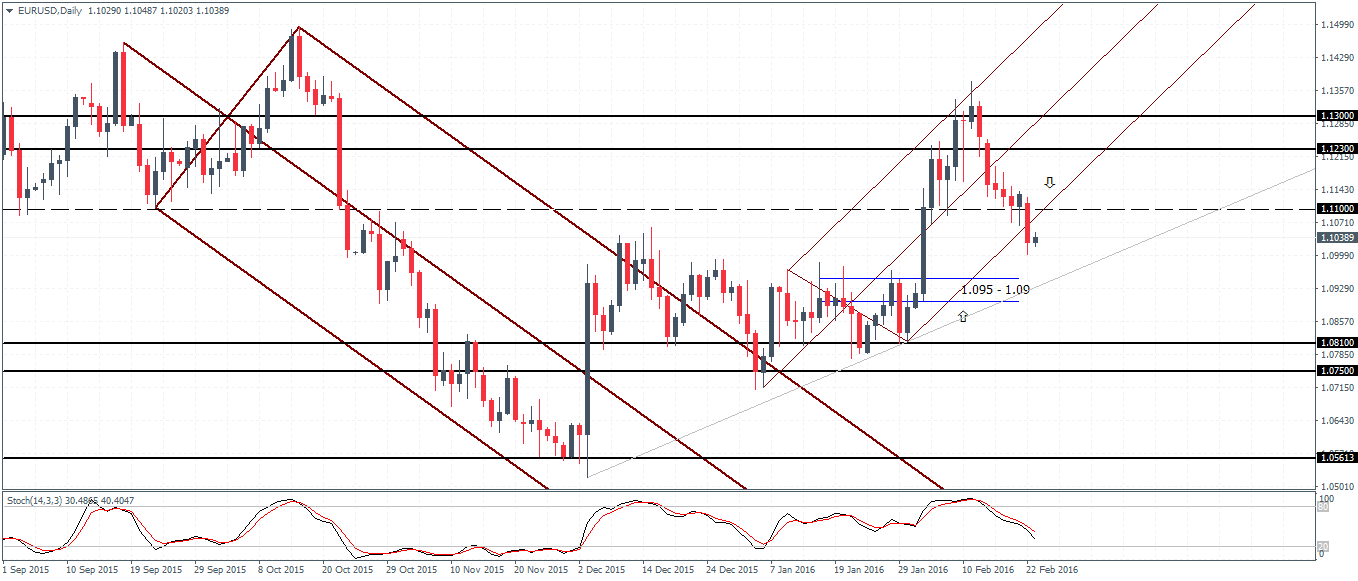
EURUSD (1.104): EURUSD is posting a steady decline after the strong rally to 1.13 resistance with prices breaking down the lower median line yesterday. 1.110 is a round number price level which could be tested for resistance. Ahead of further declines to 1.095 – 1.09 EURUSD is likely to see a pullback to form a lower high, which could be made either near 1.110 or between 1.123 – 1.110 price levels. Looking at the Stochastics oscillator, there is scope for a possible bearish divergence to take shape. In such an event, another high (lower high compared to 1.13) could see the Stochastics print a lower high leading to an eventual decline to 1.081 – 1.075 support. In the near term, EURUSD’s price action is likely to range sideways within the 1.110 – 1.08 region. Below 1.075 exposes the risk of a dip to 1.056, near the previous lows, made.
- Bias (D1): Downside
- Support: 1.095 – 1.09
- Resistance: 1.123 – 1.13
- Technical Forecast: Watch for a pullback in EURUSD to mark a lower high ahead of a longer-term decline to 1.09, with an added risk of a dip to 1.085
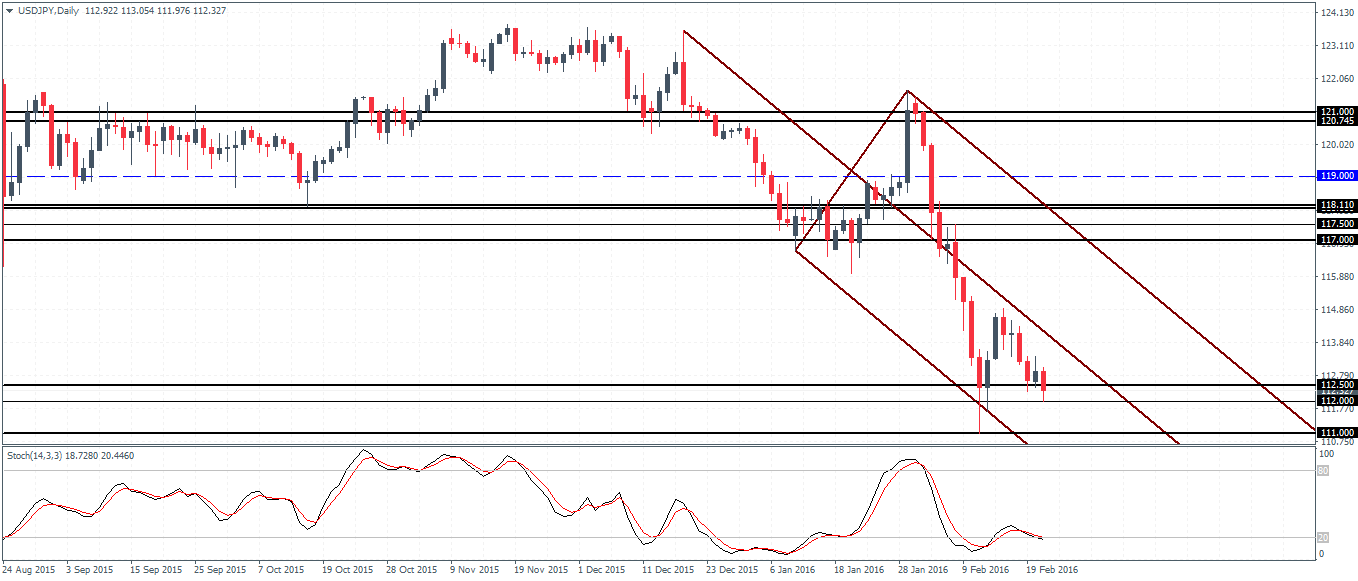
USDJPY (112.13): USDJPY attempted to break higher but price action has erased the gains off the minor bounce from 112 region. Price action is dipping lower currently at 112 – 112.5 support remains key. A bullish close off the 112 support is essential to confirm the bullish divergence in the Stochastics. This could potentially send USDJPY on a correction path to 117.5 – 117 in order to establish resistance. For the time being, USDJPY’s bias remains to the downside with the pullback to 117.5 – 117 being seen as a correction to the downside. The view is changed only on a close above 117.5 region through 118, in which case, the upside resistance at 121 – 120.745 comes into the picture.

- Bias (D1): Upside
- Support: 112
- Resistance: 117
- Technical Forecast: Watch for 112 support to hold for a move to 117. Below 112, a dip to 111.5 cannot be ruled out.
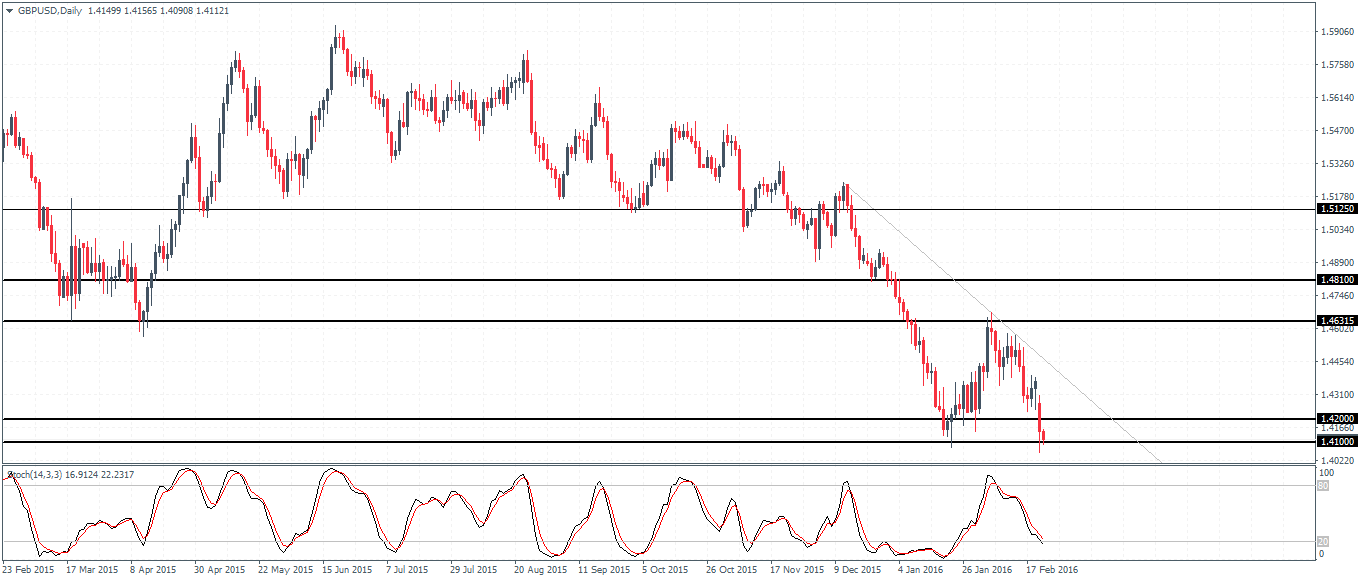
GBPUSD (1.410): GBPUSD has declined steadily ever since the hidden bearish divergence was formed on a rally to 1.4635 resistance. Prices are back near the 1.41 support. The Stochastics is currently in the process of printing a higher low against the lower low in prices. A bullish close above 1.42 will confirm a move to the upside with another potential rally testing 1.46315 and a longer term correction to 1.481. However, should GBPUSD close below 1.41 on the daily session convincingly, the bullish bets could be erased as GBPUSD could see another decline to 1.40 handle. For the time being GBPUSD looks biased to the downside, but the slowdown in the momentum could signal a potential base being formed near 1.41 – 1.40 support.
- Bias (D1): Possible base/flat
- Support: 1.41
- Resistance: 1.463
- Technical Forecast: GBPUSD could be forming a base near 1.41, but there is a risk of a dip to 1.40. To the upside, resistance at 1.463 could see a correction
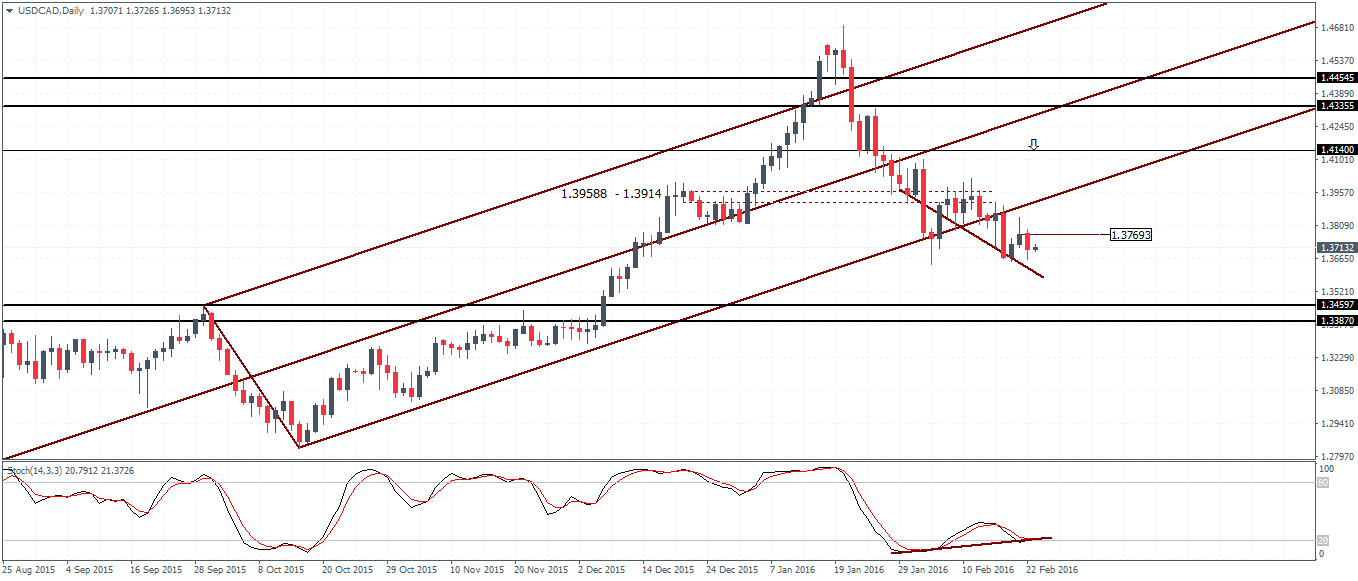
USDCAD (1.372): USDCAD is showing signs of a rebound with the Stochastics printing a modestly higher low. A daily close above 1.3769 is required to confirm further upside. The correction could see USDCAD reclaim the previously established support at 1.3958 – 1.914 where resistance could be established. Above this price zone, a move to the upside will see prices test 1.414 level. Overall, with the top being formed above 1.46, a retracement in USDCAD is on the cards with a lower high likely to be formed following a longer term decline to 1.346 – 1.3387 support.
- Bias (D1): Downside
- Support: 1.3665
- Resistance: 1.396
- Technical Forecast: USDCAD could see a potential correction to 1.396 resistance if 1.3665 support holds, considering the bullish divergence from the Stochastics
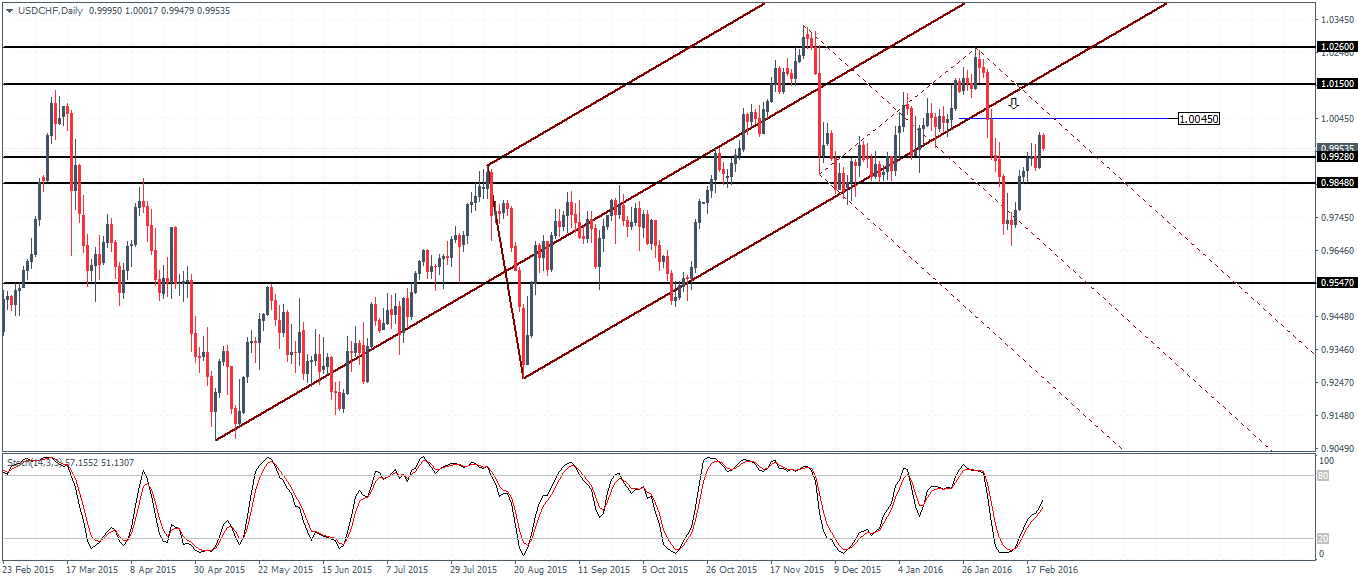
USDCHF (0.995): USDCHF has managed to rally back above 0.9928 – 0.9848 support/resistance level. The current declines could see the support level holding prices, which in turn could see a run up to the breakout level at 1.0045. USDCHF’s price action on the daily chart shows a period of sideways price action below 1.015 resistance and above 0.9928 support. Plotting the new Median line, we can expect a breakdown in prices to the downside, below 0.9848 for a test to 0.9547.
- Bias (D1): Flat
- Support: 0.9928
- Resistance: 1.0045
- Technical Forecast: USDCHF likely to range between 1.0045 but the upside seems limited, as a decline to 0.9547 is very likely.