The second estimates for the fourth quarter GDP in the US are due out later today followed by the Personal consumption and expenditure data. Expectations are dovish heading into the release, with the fourth quarter GDP in the US expected to decline from the first estimates of 0.70% to 0.40%. A dip to 0.40% in the Q4 GDP would mark the lowest pace of growth in the US economy since July 2015. On a year over year basis, the US GDP is expected to rise 1.90%, marking dovish estimates today.
Following the GDP data, PCE numbers are also due. The quarterly PCE is expected to rise 2.20% for the fourth quarter while the core PCE which strips the volatile components such as food and energy is expected to rise 1.20% for the period. On a month on month basis, Core PCE is expected to rise a modest 0.10% in January while the Core PCE is expected to tick higher, rising 1.50% on a year over year basis in January.
Overall, the economic data today from the US is likely to shape the short-term dynamics.
US Dollar Technical Outlook

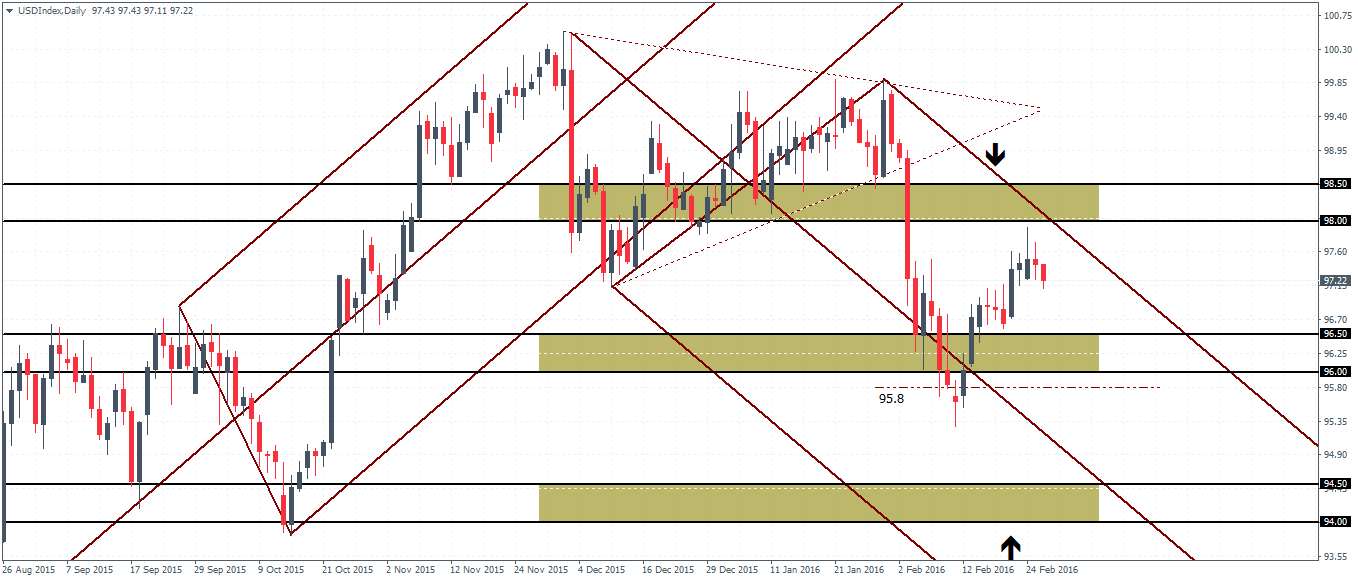
The daily chart for the US Dollar Index shows price has been steadily climbing following the break above 96.5 support. There was no pullback to test the support level while at the same time; the price hasn’t rallied to test the upper resistance at 98. This could mean, the US Dollar Index could either continue to push higher to test 98, or it could pose a correction down to 96.50.
The daily chart on the US Dollar Index shows an inside bar being formed yesterday. A daily close below the lows of 97.23 could no doubt signal further downside to come with 96.5 being the ideal support which could be tested.
On the weekly chart, following the break of the median line, prices dipped lower but soon reversed back to the upside. On the weekly bar, the inside bar has seen a follow through this week with a push higher, but falling short of the test to 98 resistance. Highlighting the support of 96.5 from the daily chart, we can expect a potential close to this level on the weekly chart, which could still point to uncertainty. On the weekly, a close below 95.28 will signal a decline to 94.50 – 94 support.
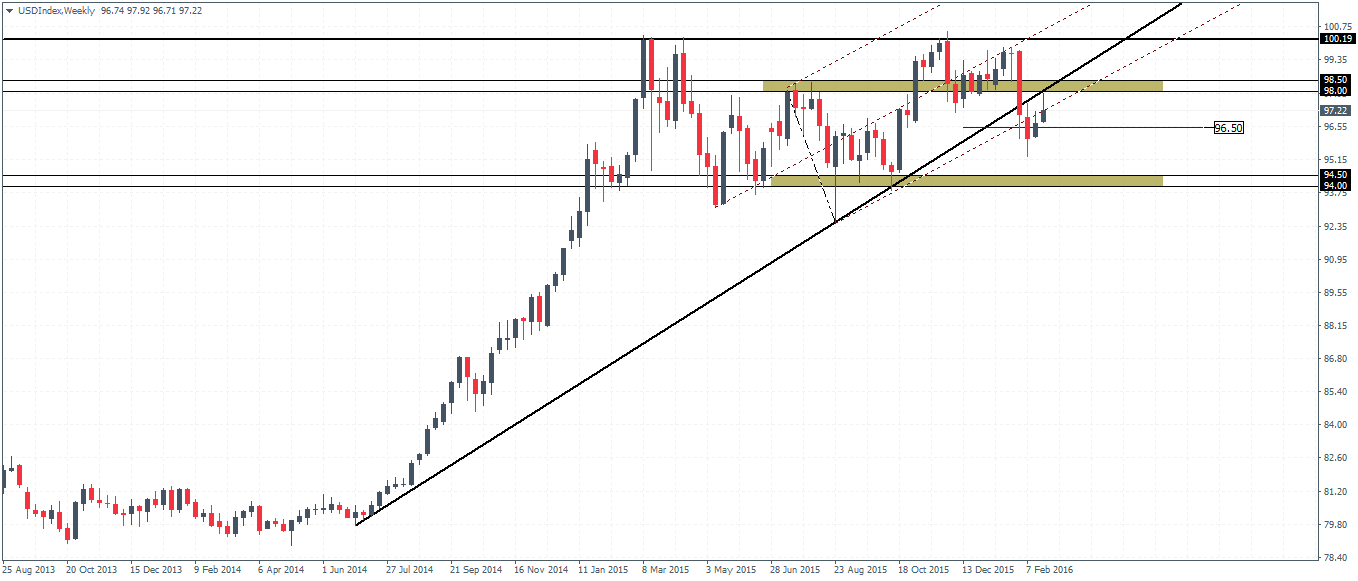
In conclusion, the US Dollar remains range bound within 98 and 96.5 for the near term as the upside risks continue to fade away following the strong resistance near 98 – 98.5 region

