
The precious metal’s rally over the past six weeks has seen one of the sharp gains that weren’t typical of an asset which has been repeatedly hammered by the bears. The pop in Gold prices this week saw prices testing the $1200 psychological barrier, and one which was achieved rather quickly. From our previous analysis, we set an initial target to 1154, based on the Cup and Handle pattern, but the gains made 1154 a rather conservative level in hindsight with absolutely no pullbacks either. This strong momentum led gains could, however, pose a risk of a strong reversal on the lack of any support levels being formed. It was not only Gold but Silver as well which surged strongly, testing the 15.4 resistance level in just under two weeks, after forming a base near 13.86.
Gold – Technical Outlook
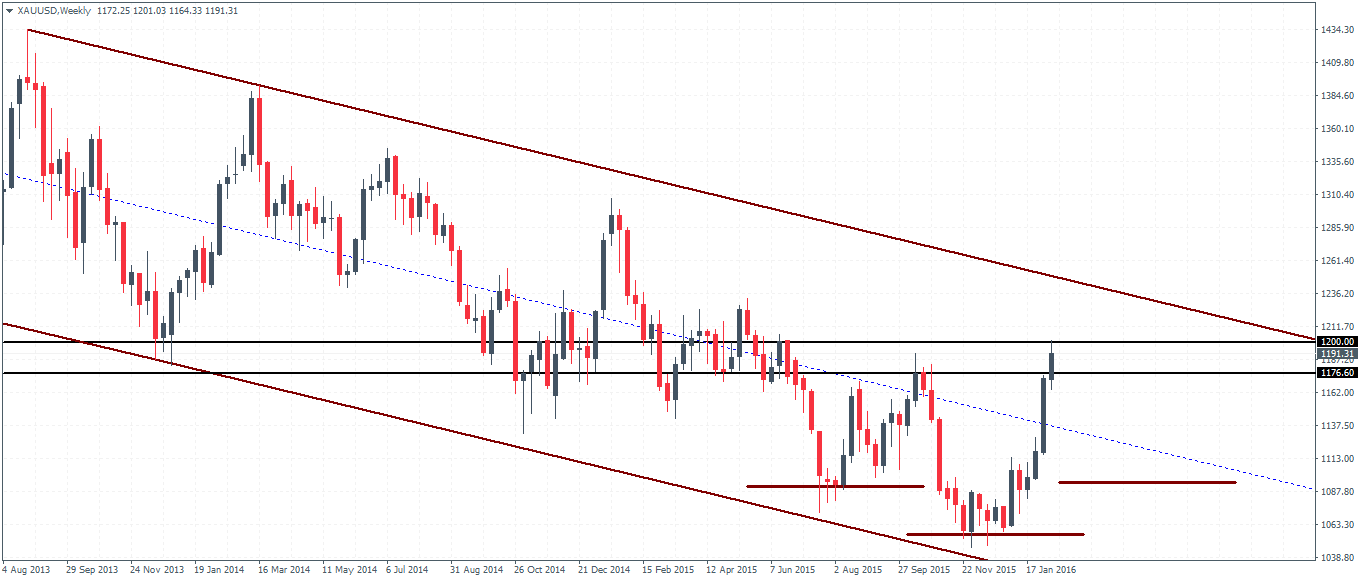
Starting with the weekly chart for Gold, we notice a major resistance level near the 1200 – 1176 handle. Prices previously tested 1176 before falling lower to post new lows near 1040 -1050 levels. Overall, there is scope for Gold to form a potential longer term inverse head and shoulders pattern, if the resistance at 1200 holds from a weekly time frame. 1087 – 1090 levels look to be an ideal retracement if indeed Gold manages to pull back, forming a potentially bullish right shoulder. Of course, a breakout above 1176 – 1200 level would be required to follow up on such a scenario.

On the daily chart for Gold, we notice a strong hidden bearish divergence being formed with the support level of 1089 – 1078 marking a retest of this broken resistance level to establish support. If indeed prices move lower, we could expect to see this pullback coinciding with the weekly chart’s potential right shoulder level. However, in order for 1089 – 1078 levels to be tested for support, Gold will need to break down the cup and handle’s neckline level of 1108 – 1099. As of yesterday’s close, Gold prices closed with a doji candlestick pattern indicating indecision. The doji pattern just below the 1200 resistance after strong rally points to a potential decline or correction in the near term.
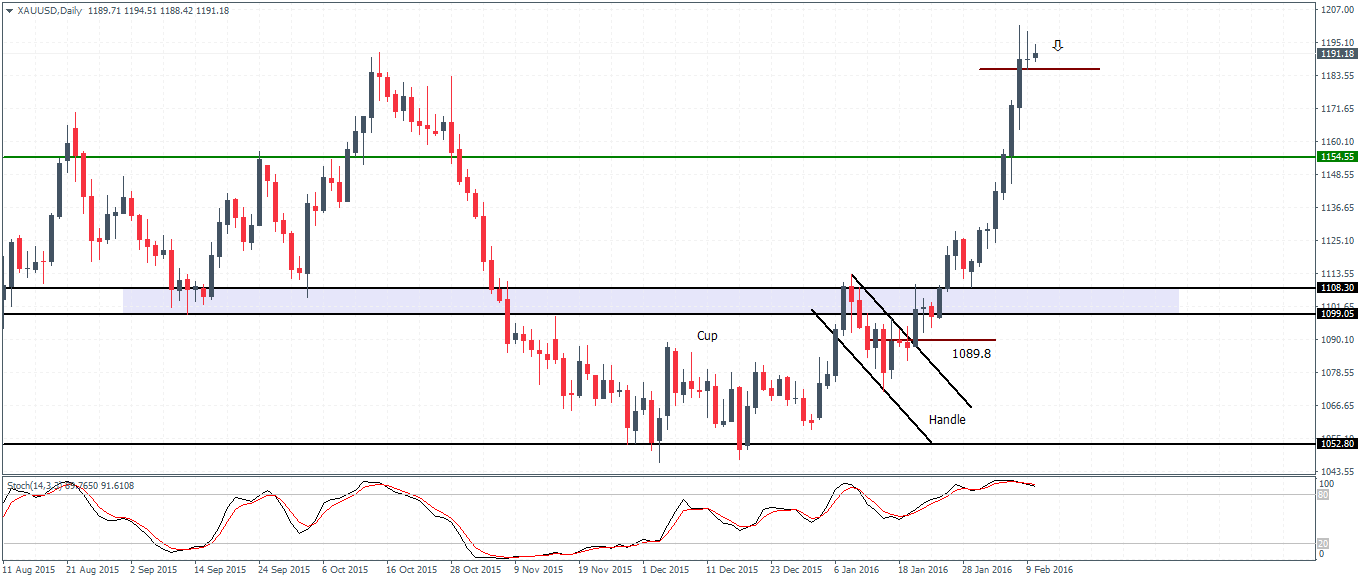
In conclusion, Gold’s outlook remains bullish as $1100 support is now key. Even a break lower to 1080 could still keep Gold biased to the upside on a potential inverse head and shoulders that could be formed. To the upside, a pullback in Gold prices is well overdue.
Silver – Technical Outlook
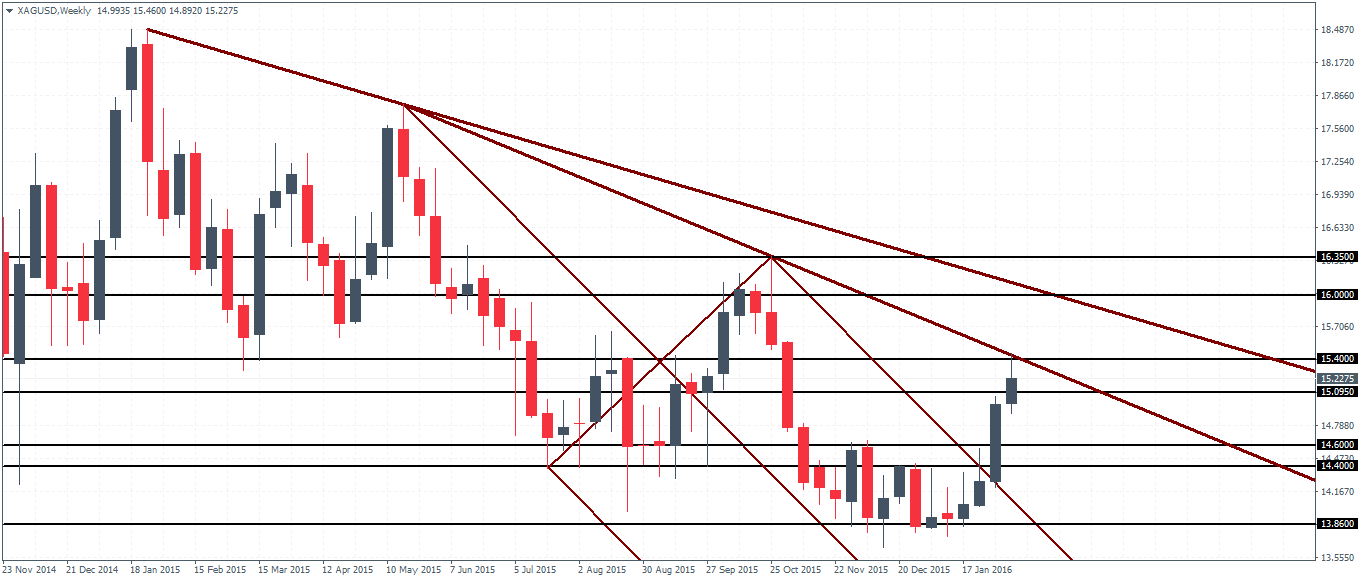
With prices now trading in the resistance zone of 15.40 – 15.09, there is a possibility of a decline lower back to the minor support at 14.60 – 14.40. The move lower is supported by the first and minor weekly trend line. A pop higher above 15.4 could potentially push Silver prices to October 2015 highs of 16 and above.
On the daily chart for Silver, we notice prices trading near the outer median line following a strong momentum led a breakout. Support now comes in at 15.0 round number and only a break below this support will take Silver lower to 14.40 where a pending test of support on a previously broken resistance level could strongly support prices. The bias in Silver remains to the upside as long as 14.40 support does not give way, in which case a retest back to 15.4 is likely with a potential break higher to 16.0 handles.
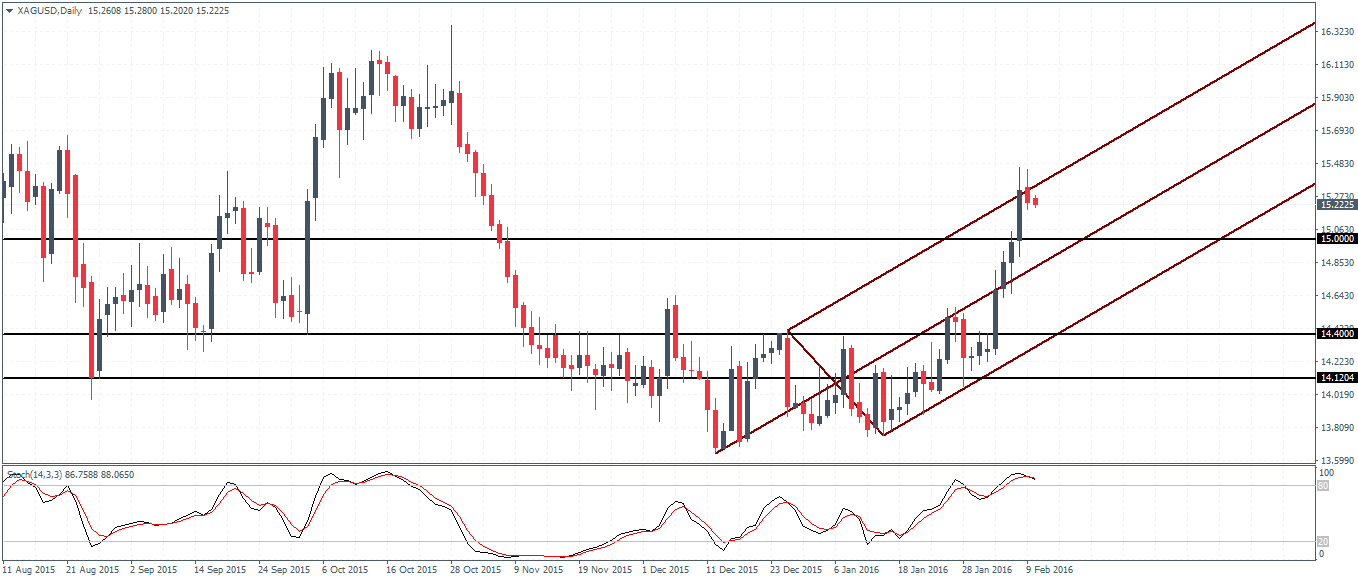
In conclusion, Silver prices remain biased to the upside, with $15.0 coming in as a strong support level. A move to $16 cannot be ruled out and only a close below 14.4 – 14.5 will see the bearish trend resume.

