
The US consumer inflation data is due for release during the NY trading session today with expectations staying mixed. Consumer inflation excluding food and energy is expected to rise 0.20%, up from 0.10% previously for the month while headline CPI is expected to decline -0.10%, down from -0.10% a month ago. On an annualized basis, core CPI is expected to rise 2.10%, same as from the previous month while the headline CPI is expected to rise 1.30%, up from 0.70% previously.
Fed officials have expressed concerns on inflation staying stubbornly below the Central Bank’s 2.0% target rate according to the FOMC meeting minutes released yesterday. While the Fed prefers to watch the PCE data, today’s CPI numbers will no doubt shape the market sentiment. Recent inflation data from other developed economies showed a broad match on estimates with no major downside surprises, leading to expectations that US consumer inflation data is likely to either match estimates or perhaps even rise stronger than expected.
Also, on the calendar today will be ECB’s Draghi speech to the European Council in Brussels. ECB members have taken a more guarded approach in their comments in the context of policy actions that could be taken in March, indicating that members of the ECB governing council are likely to stay tight lipped and not raise expectations too high. It is likely that the ECB could be looking at some kind of a ‘shock and awe’ approach should they decide to further loosen monetary policy. Regardless, the Euro comes under significant risk with ECB president, Draghi and Vice-president Vitor Constancio both due to speak during the day.
US Dollar Technical Outlook

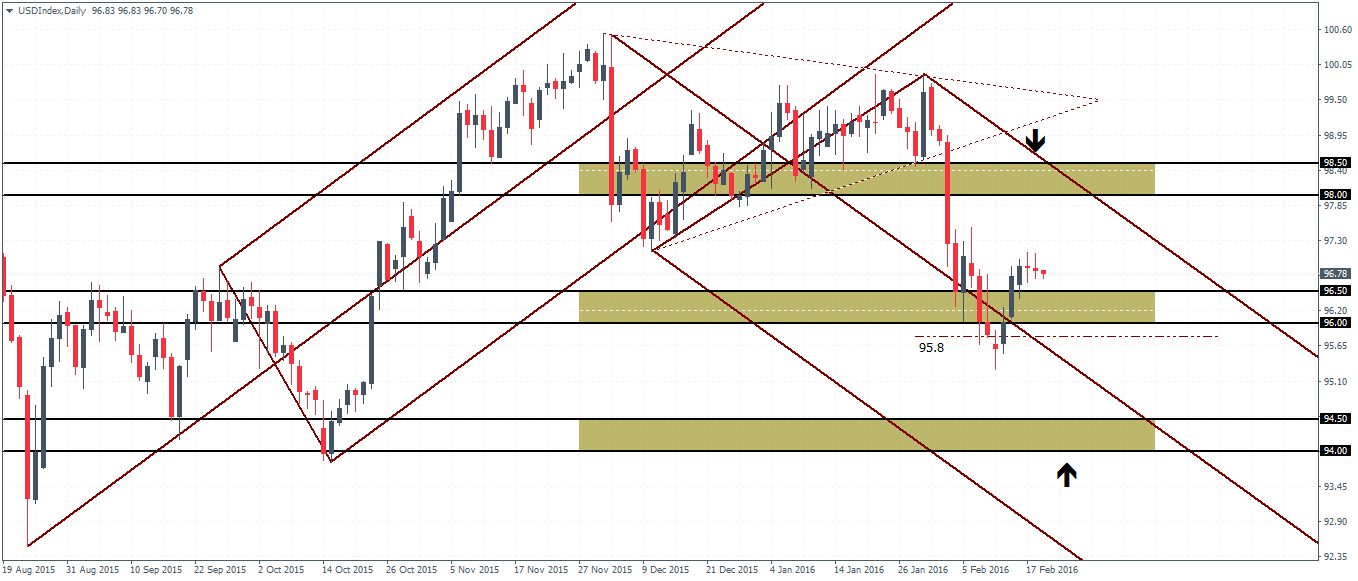
From the technical perspective, the US Dollar Index has managed to close above the 96.5 support. The recent price action in the past two days has resulted in a doji candlestick pattern. The downside in the US Dollar Index is limited as long as prices are supported in the 96.5 – 96 support level, with a scope for a decline to as low as 95.8.
To the upside, however, the recent price action marking the declines off 98.95 leaves a lot of room for the US Dollar Index to correct higher. As such, any dips in the Dollar Index are likely to stay limited for the most part above 95.8. In the unlikely event of a break below 95.8, strong bearish momentum could quickly send the Dollar Index to lower to 94.50 as shown on the daily chart.
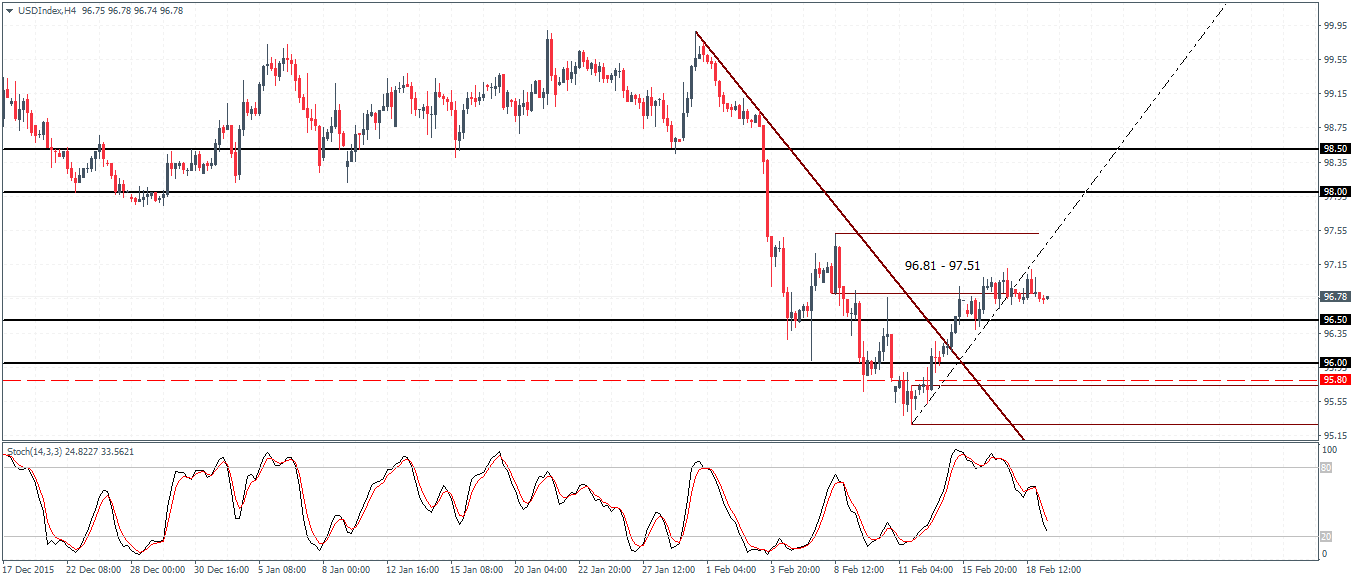
On the 4-hour chart, we can notice that following the hidden bearish divergence, prices have been consolidating near 96.81 minor support which is being tested for resistance. A dip lower could see a test to 96 at the very least confirmed by the break of the minor trend line. A dip to 96 could potentially see a bullish divergence that could be formed, comparing price action to the Stochastics oscillator. Waiting for a confirmation near 96 – 95.8 could signal for a move higher to the 98 resistance level.
Looking ahead, data from the US is largely limited for the first part of the week, with the second estimates for the Q4 GDP due only on 26th February, next Friday. We could, therefore, expect prices to remain drifting until then.

