
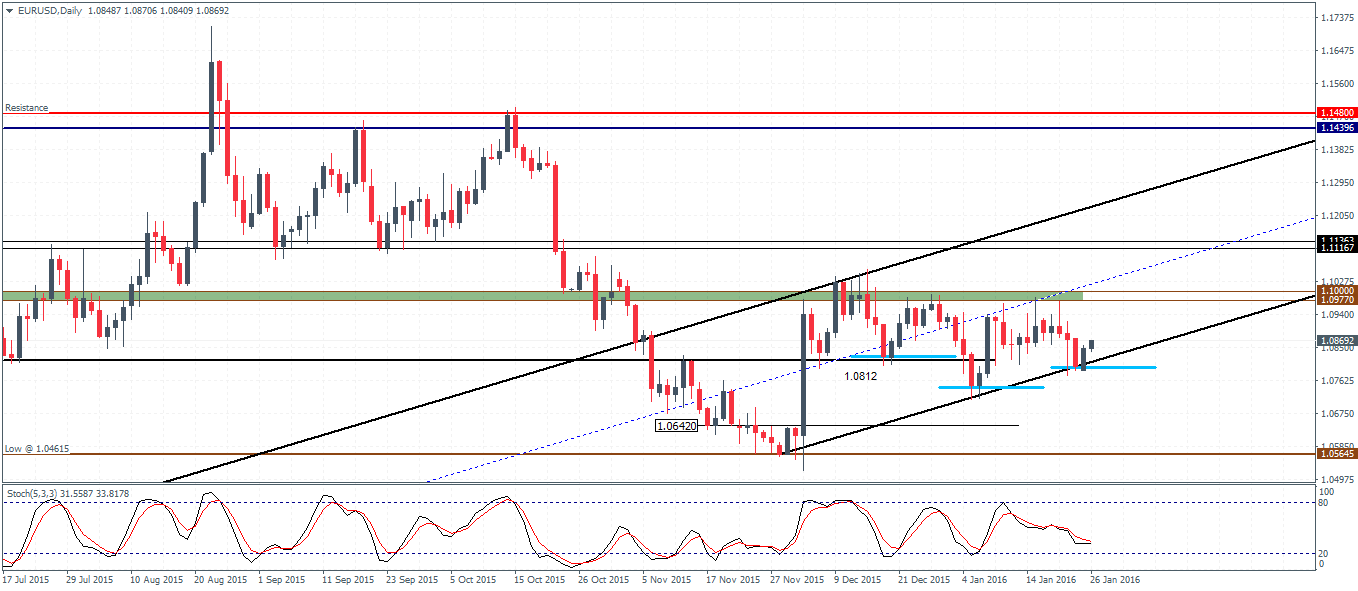
EURUSD (1.08): EURUSD is in the process of forming an inverted head and shoulders pattern after the right shoulder was established near 1.08 support in the last two days. A move to the upside will see an eventual test to 1.10 – 1.0977 neckline, which if breaks could validate the inverted head and shoulders pattern. This move would eventually give way for a test to 1.113 – 1.1116 level, followed by an eventual test to 1.12. Alternatively, in the case of a failure near the right shoulder a break below 1.08 support could see EURUSD invalidate the inverted head and shoulders pattern and aim for the previous pivot low support formed at 1.073 – 1.075 which is marked by the inverted head’s low. However, with the price channel showing dynamic support off the current level, a move to the upside seems more likely.
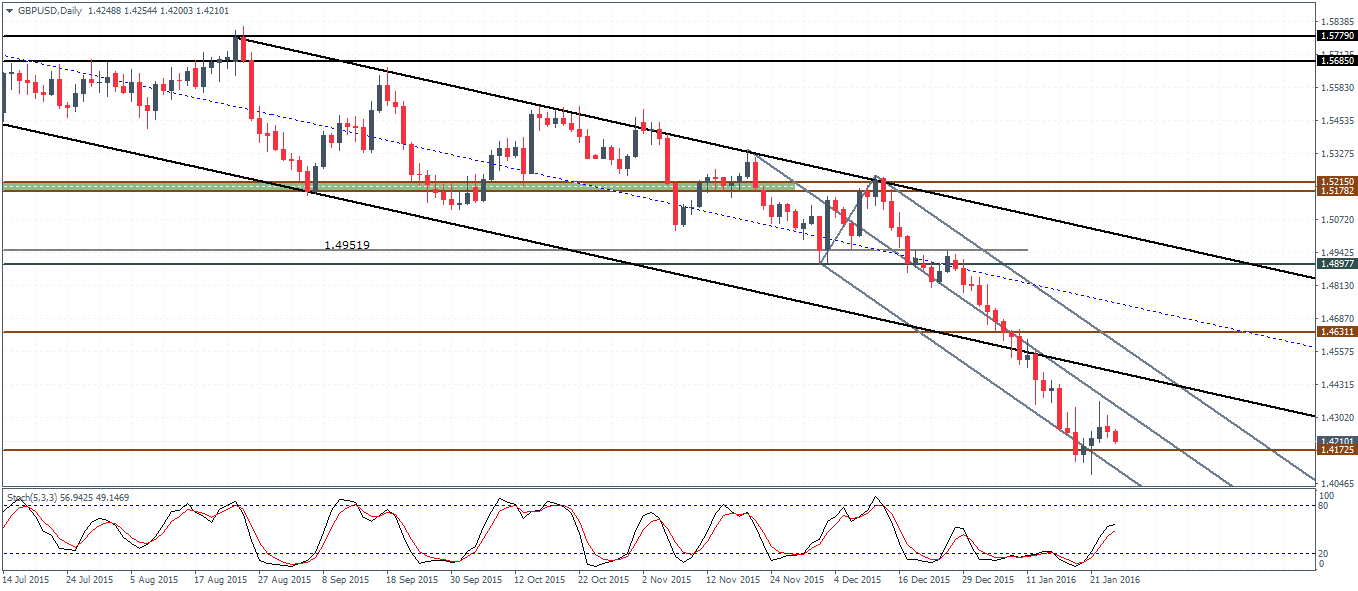
GBPUSD (1.42): GBPUSD is likely to see some correction to the upside on a successful test of support near 1.41725 – 1.415. This could see an eventual test to 1.463 which is marked by the previously broken support and makes for an ideal price level which could be tested for resistance. In the event of a break below the support at 1.415, GBPUSD could remain range bound and could be in the process of forming a bottom. Below 1.415, 1.40 remains the next key support level to watch for.

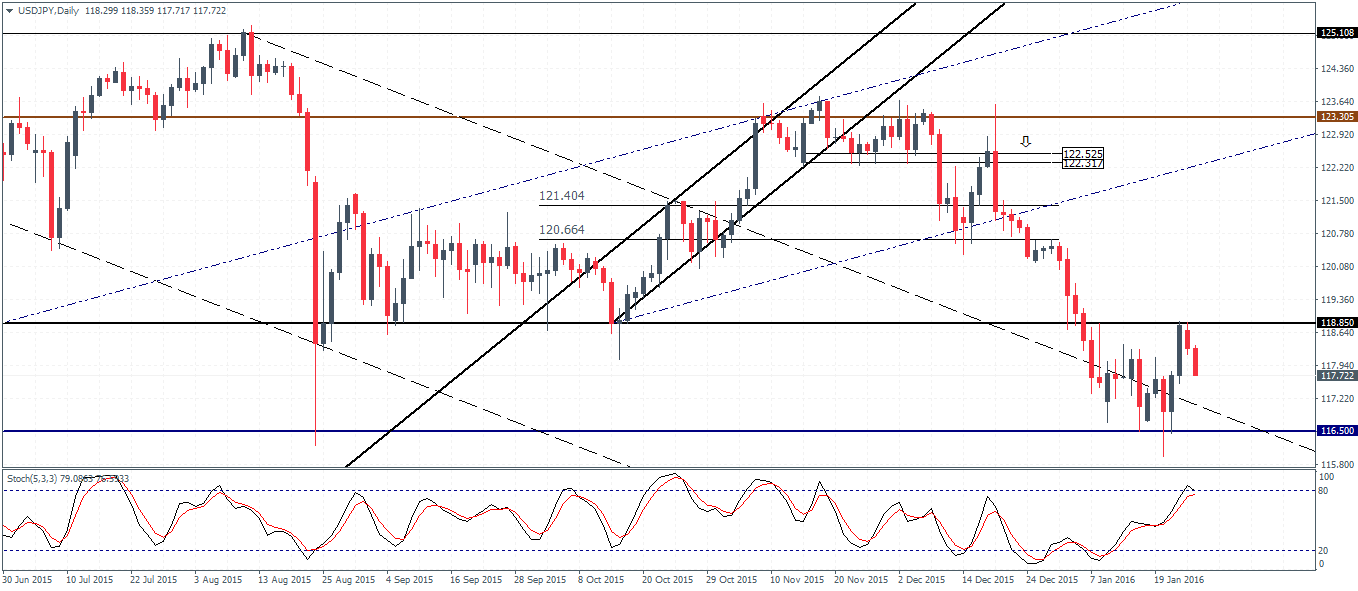
USDJPY (117.7): USDJPY rallied to 118.85 but prices were rejected sharply at this level. The move to the downside could see another test down to 116.5 support. Prices are likely to stay within 118.85 – 116.5 levels ahead of a potential breakout. To the upside, a successful break above 118.85 could see a test towards 120.78 – 121 level of resistance while, to the downside, a break below 116.5 could see a test to 115 eventually. The Stochastics on the daily chart is currently in the overbought levels and points to a move to the downside.
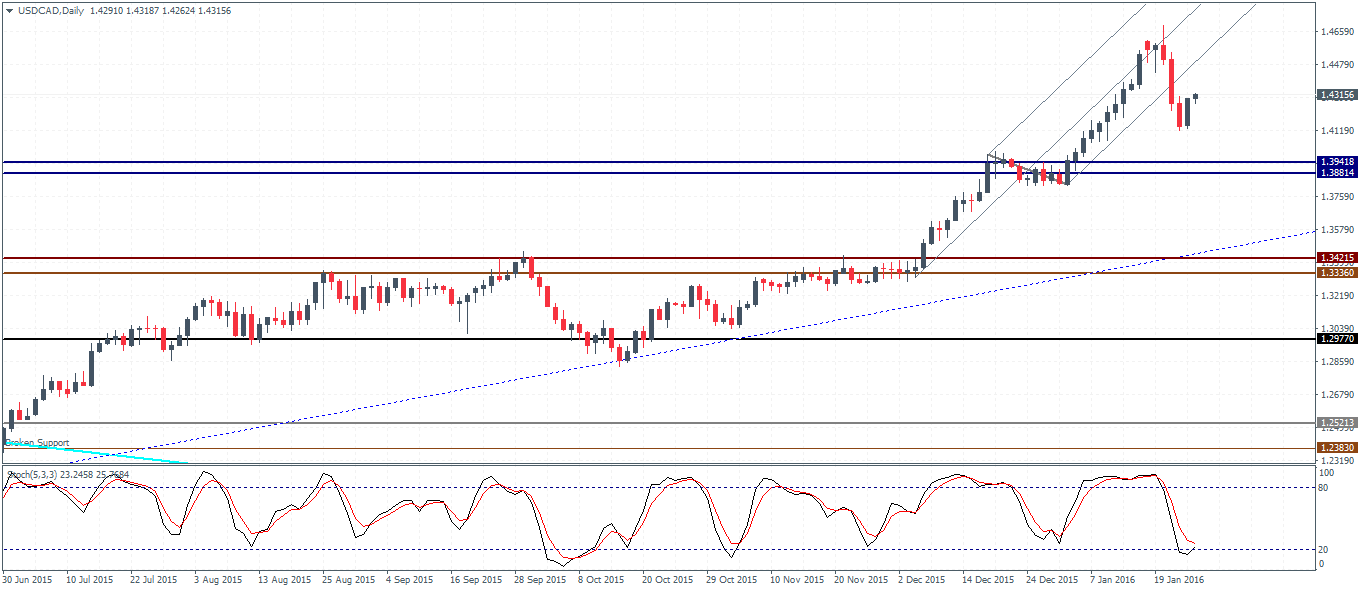
USDCAD (1.43): USDCAD saw a price failure near the median line as pointed out in last week’s analysis. Price action is currently looking to retrace some of the losses with a test back to 1.4479 region at the very least. As long as the previous pivot high near 1.4659 is not breached, USDCAD could be looking at an eventual drop to 1.395 support, which was previously a resistance level. Establishing support at 1.395 could mark a renewed move to the upside, but also opens the risk of a support failure, which could see a decline down to 1.3421 support.
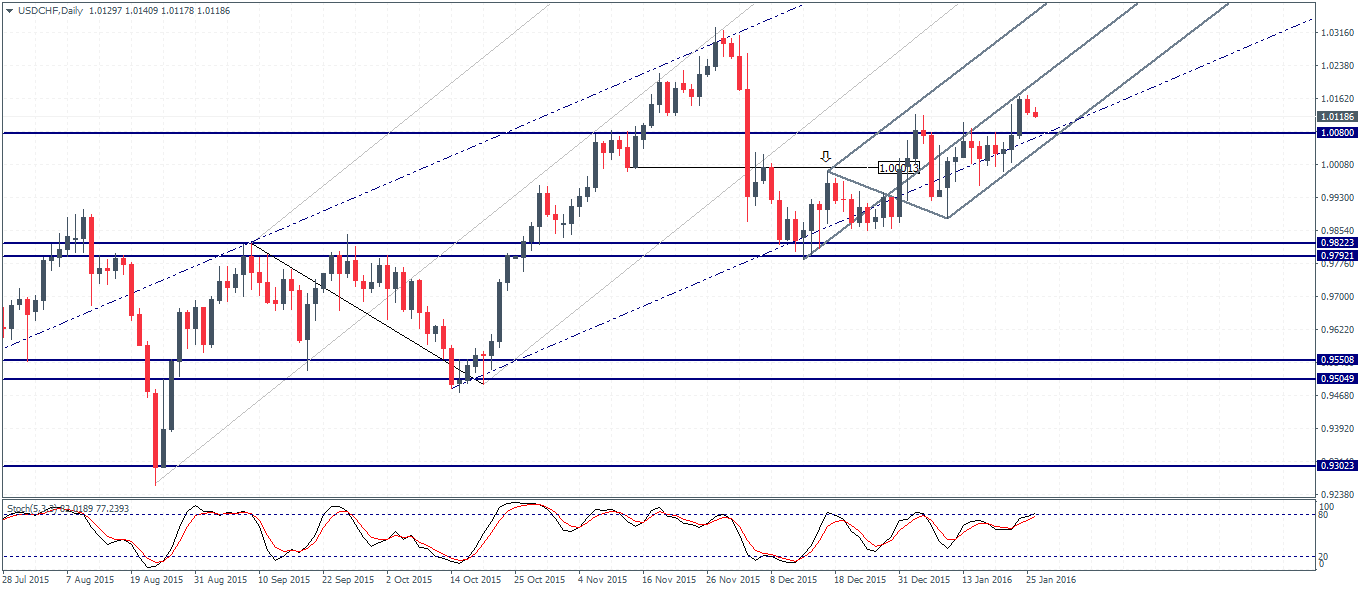
USDCHF (1.01): USDCHF is currently trading near the median line and formed an inside bar yesterday. A break below 1.008 could trigger a move to the downside and risk a decline to 0.982 – 0.98 support. In the likely event that prices manage to form support near 1.008, USDCHF could be aiming for another leg higher on a break above the previous pivot high above 1.015

![Credit Card 160×600 [EN]](https://assets.iorbex.com/blog/wp-content/uploads/2023/06/13144507/Blog-Banner_EN-Banner_160X600X2.webp)