Summary: With the FOMC Meeting due next week, the US Dollar Index is likely to stay flat below the 100 resistance and 98 support.
Following up from last week’s analysis for the US Dollar Index, price action has remained somewhat subdued as expected. The Dollar Index is starting to show signs of another test to the 100 psychological level but on low momentum, price action is likely to stay limited. The slowing momentum is, however, no doubt starting to lay the groundwork for the potential decline over the next coming weeks. Economic data from the US this week has been fairly modest but nothing to talk home about.
The week over week, unemployment claims continue to rise more than expected but remain at historical lows. This, however, signals the potential for a decline in the US labour markets over the next month or two. Furthermore, China’s increasing market intervention continues to remain a drag for the Dollar.
The week ahead is likely to be interesting as the US Federal Reserve meets for its first monetary policy meeting this year, and the first after a rate hike in December 2015. Expectations are flat with the Fed unlikely to go for another 25bps rate hike in just over a month. Therefore, the FOMC statement and the Press Conference is likely to garner a lot of attention keeping the US Dollar at risk.

US Dollar index – Technical Analysis
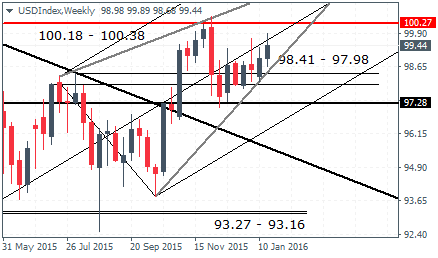
The weekly chart for the US Dollar Index shows remains within the rising wedge consolidation pattern just below the 100.18 – 100.38 level. Support is established near 98.41 – 97.98 indicating a potential test to this resistance level. As from last week, only a break above 100.18 – 100.38 will signal further upside and we expect this scenario to be limited. A break below 97.98 is key to watch for as a close below this support could potentially open the way for some declines and a much-needed correction in the US Dollar Index.
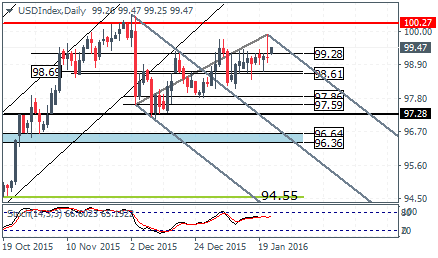
On the daily chart, the re-adjusted falling median line shows how prices managed to consolidate above 98.61 – 98.69 support and increase the chances for a break to the upside. 100.27 on the daily chart is a level to watch for an upside breakout while to the downside, a close below the support could see a test to 97.28 – 97.59 support. The Stochastics on the daily chart shows a bearish divergence building up which shows an imminent correction down to 97.28 support validating the Median line bias.
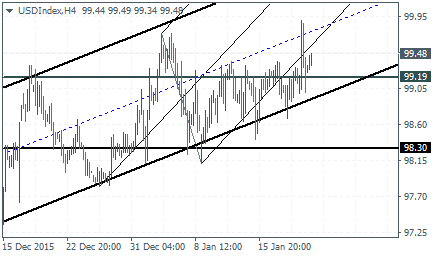
On the 4-hour chart, the Dollar Index broke above 99.20 resistance but prices were rejected on the following rally. A dip back to 99.20 could provide the much-needed support for another attempt to push higher. In the unlikely event that the Dollar Index fails to establish support at 99.20, a decline down to 98.30 is possible.
For the near term, if 99.20 support holds, the US Dollar Index could be looking at some short term gains with an eye on testing the 100 psychological level. However, the upside remains limited as the Dollar Index is likely to see the gains being capped below this resistance. The price action looks convincing for a test to 97.28 support for further bias to be established. Until then, the US Dollar Index is likely to remain range bound.

