
Gold futures are easing back this week after posting a strong rally a week before, primarily due to risk aversion. Gold is currently trading at $1085 an ounce and is down -1.67% for the week after posting an intra-week high at $1108.63. Silver prices, on the other hand, saw a failed attempt last week with prices falling near 14.37 support where resistance is now established. For the week, Silver is down -0.85%. With the markets returning to normalcy after the volatile moves last week mostly led by China, prices in the metals markets could remain range bound for a while.
Gold – Technical Outlook
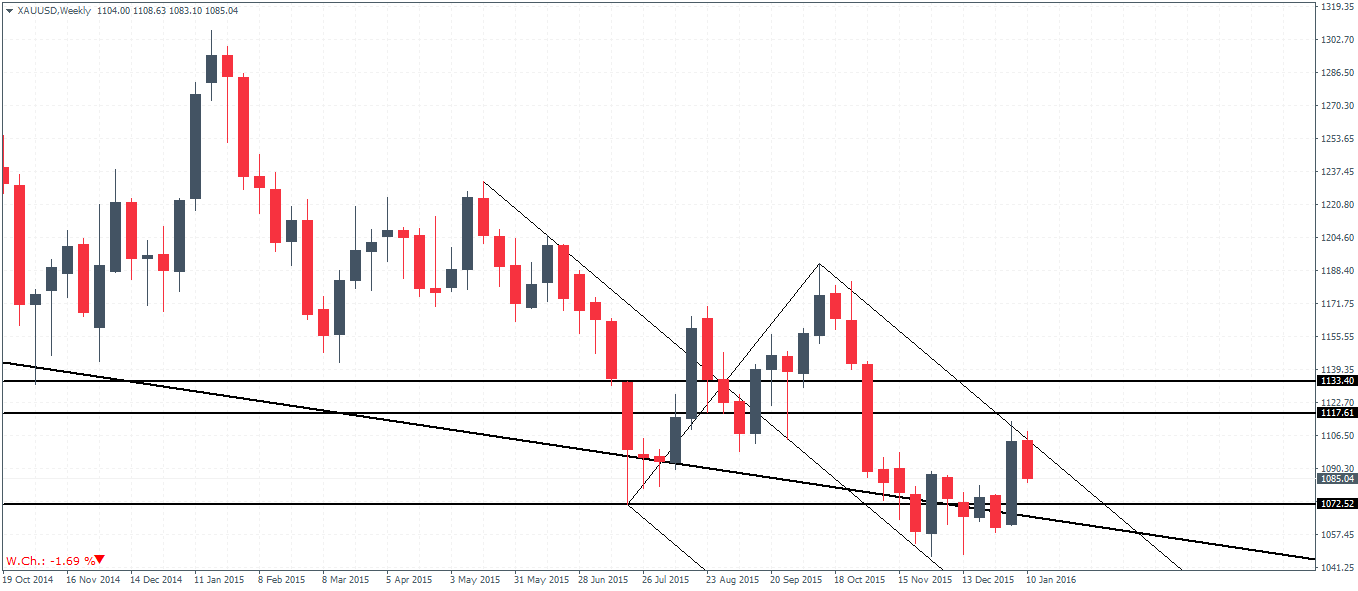
The weekly chart for Gold shows that the current week’s decline came across with prices being rejected near the outer median line on the weekly chart. Support is well founded near 1072.55 where any declines are likely to stall. The price level of 1072.55 also shows confluence with the dynamic support being offered the long term trend line as well. As such Gold remains sideways on the medium term trend.

On the daily chart, price action reacted as expected with the resistance near 1107 – 1101 pushing prices lower. 1074.62 remains a key level to watch for now which marks the breakout from the daily chart’s triangle pattern where prices broke out initially. A retest to this breakout level could potentially mark a new momentum being built up in prices however a break below 1074.62 could signal a bearish continuation with the potential to break below the median line and push lower.
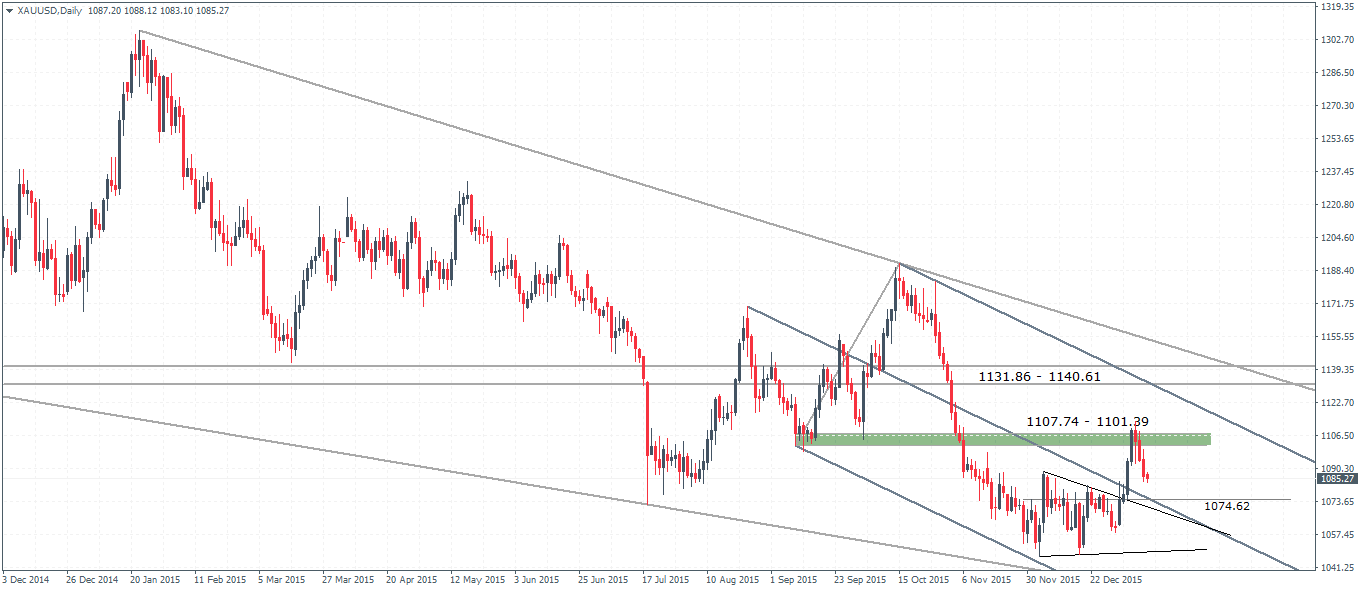
To conclude, Gold prices remain range bound for the moment but 1072 is a level to watch. Prices could either rally strongly off this lower support or a break below the support could signal a move lower and invalidate any bias of a move higher.
Silver – Technical Outlook
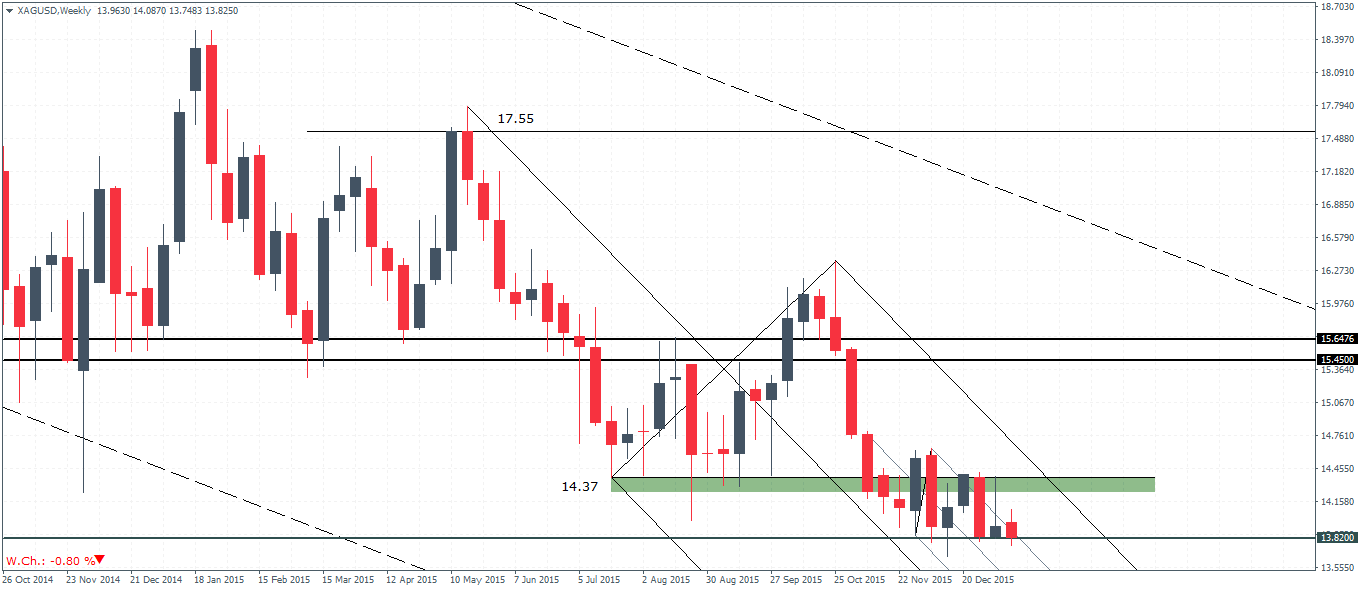
Silver prices have seen a rejection near $14.37 support to establish resistance. The current weekly price action is posting a bearish engulfing on the body of last week’s price action but is stalling near 13.82 minor support. A break below 13.82 could signal further declines lower with Silver likely to post new lows. On the other hand, if prices stall at this support, Silver prices could expect to see some kind of bounce to the upside, provided the previously established resistance at 14.37 is broken.
On the daily chart, Silver prices are seen to be consolidating near 14.12 – 13.82 region of support/resistance. To the downside, 13.65 will be the next key support level to watch for. The Stochastics on the daily chart is currently printing a modestly higher low in comparison and a bullish divergence forming here could see Silver snap back higher towards 14.56 on a break above 14.12. A move above $14.56 could see Silver continue to move eventually higher to $15.64 – $15.45 resistance in the medium term.
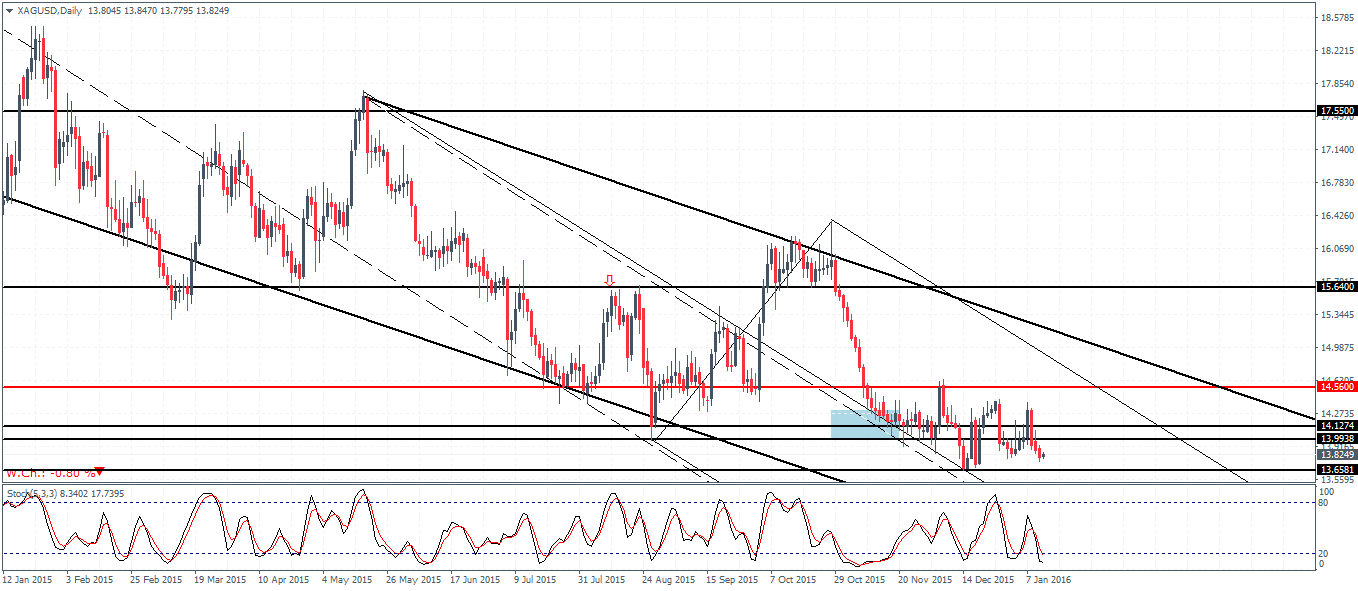
To conclude, Silver prices remains modestly biased to the upside at $13.65 support holds. A test to $14.56 could eventually see prices push higher towards $15.64 – $15.45 resistance. However, in the event of a break below $13.65 Silver could turn bearish and could potentially see new lows being posted.

![Credit Card 160×600 [EN]](https://assets.iorbex.com/blog/wp-content/uploads/2023/06/13144507/Blog-Banner_EN-Banner_160X600X2.webp)