The precious metals have seen a recovery rally over the week. Gold is up 0.70% for the week while Silver prices gained 1.02% on a week to date basis. This comes amid a short trading week and low volumes. The most recent economic data from the US included the final revision to the third quarter GDP which came out at 2.0% down from 2.10% from the second revision leading to a modest decline in Gold prices. We expect prices to continue to trade within a range into the New Year on low trading volumes and lack of any major market data to go by.
Gold – Technical Outlook
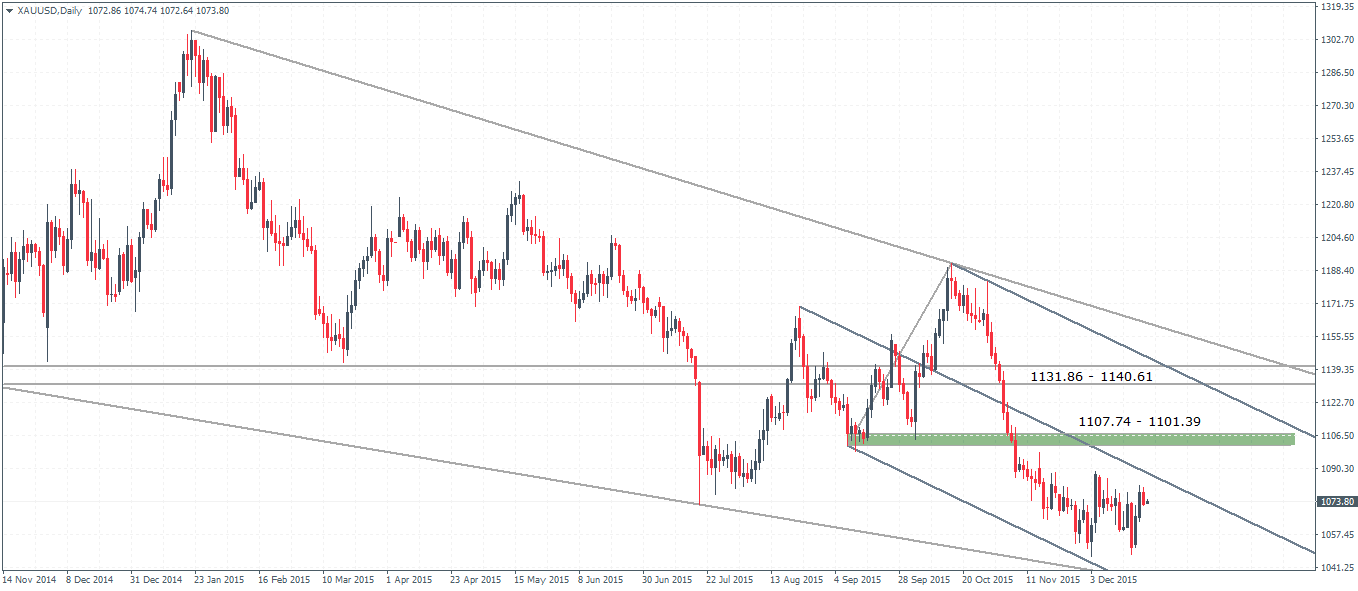
The daily chart for Gold shows prices posting a longer term consolidation within the large descending triangle. Plotting the median line on the most recent price action, we notice a lower median line failure, which could see prices rally to test the Median line. There is a potential resistance near 1107.74 – 1101.39 which is most likely to see a test to the upside. A close above 1107.74 could see prices move another leg higher towards the longer term resistance near 1131.86 – 1140.61 region.

On the 4-hour chart for Gold, prices have been range bound between 1088 and 1051 lows. Zooming in the charts however, we notice that the recent bounce off 1051.09 lows saw a strong rally towards 1078.4 level of minor resistance, coming off the median line. The resulting doji and the lower close saw prices decline down to 1074 at the time of writing. We expect a further decline lower to test the breakout from the median line, near 1068.5. A successful retest here could signal a further move to the upside with the potential to test the 1088 region in the near term. A break below 1068.5 could however push Gold prices down to the next main support near 1062.54 through 1060.2 level.
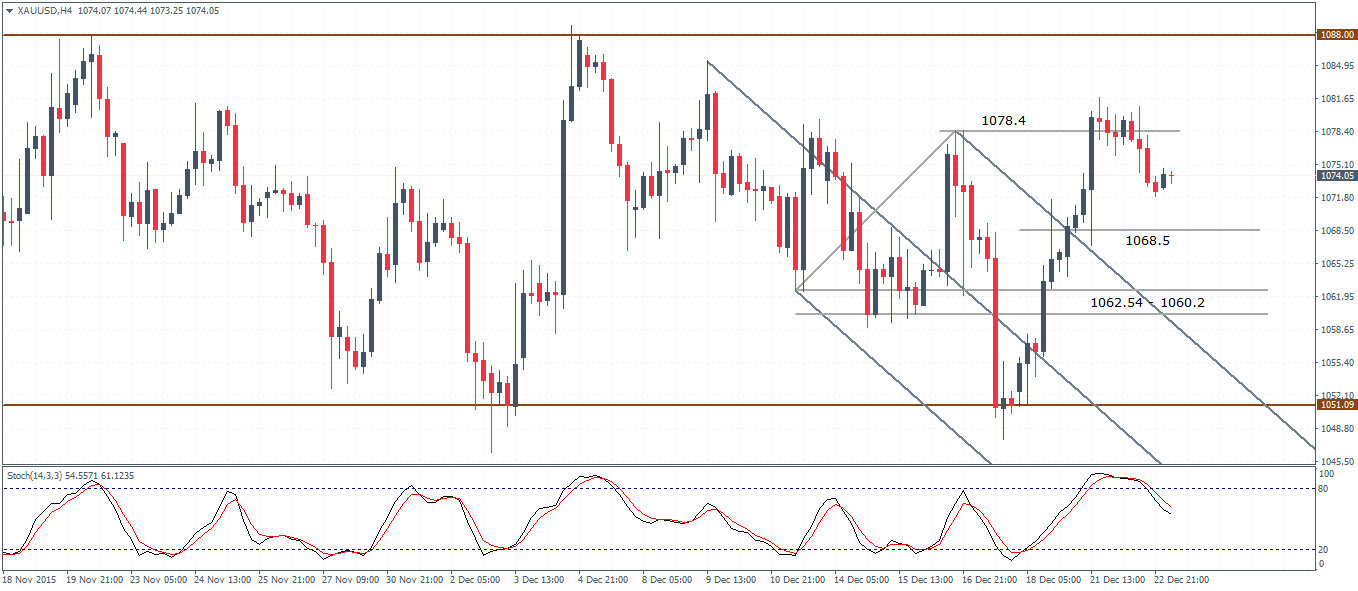
To conclude, Gold prices could see a short term decline down to 1068.5 region and is likely to see a longer term rally towards 1107 – 1101 region.
Silver – Technical Outlook
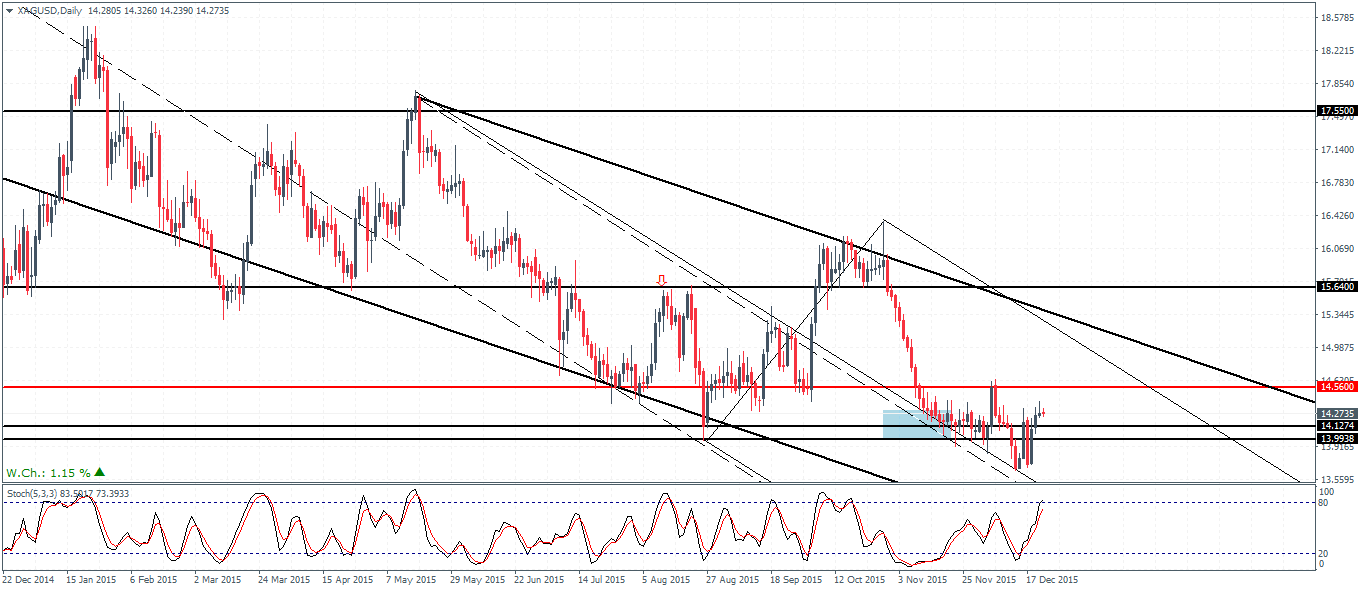
Silver prices have been trading similar to Gold in terms of price action. The daily chart has seen strong moves between 14.12 – 13.15 levels in the past few sessions. However, with prices above 14.12 – 13.98 region of support, the declines are likely to remain limited. There is scope for a move to the upside to test the 14.56 resistance which was tested on a previous occasion. The risks to the downside are likely to open up if Silver fails near the support level. The daily chart Stochastics has printed a hidden bearish divergence which signals a short term move lower and price is likely to trade in the consolidation levels near the previous low.
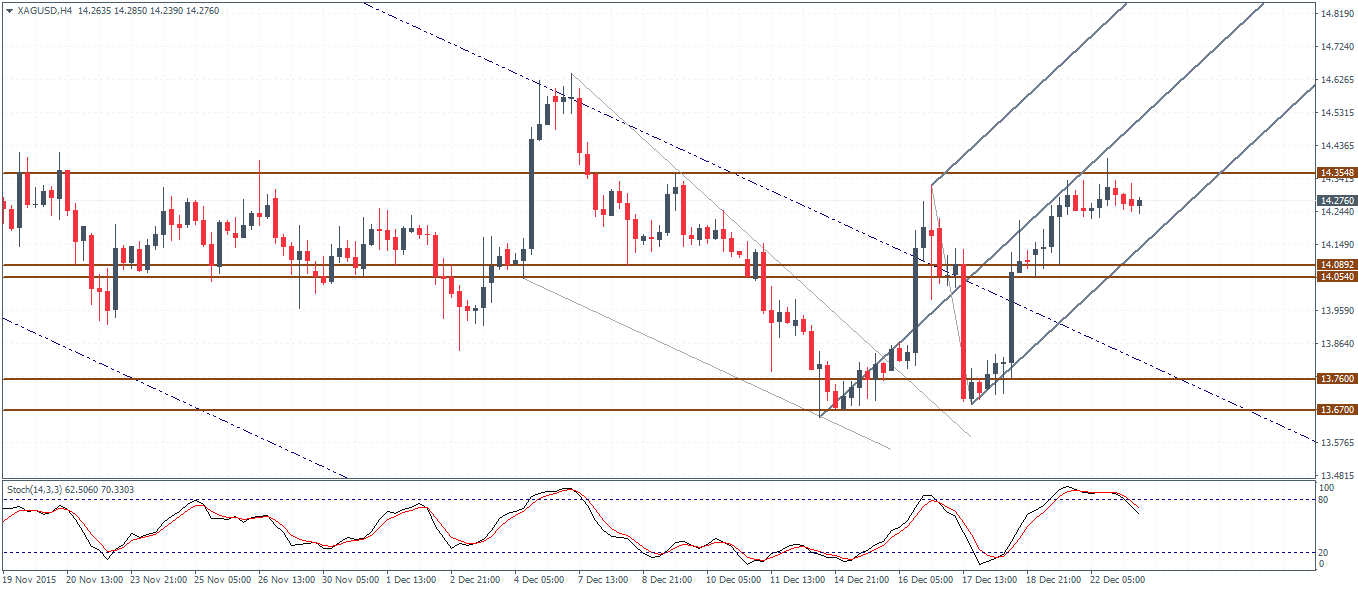
The 4-hour chart for Silver shows prices failing near the Median line and the horizontal resistance near 14.35. A move lower could see a test back to 14.08 – 14.05 level which marks a previously established support zone. In the event that prices break out from the lower median line, the support zone near 14.08 – 14.05 could be at risk with a likely move lower to the previous lows near 13.76 – 13.67 region.