The commodity markets have been under pressure in the recent weeks, but Gold prices managed to hold their ground initially but soon gave up to trend lower along with Silver. At the time of writing, Gold prices are down -0.95% on a week to date basis, while Silver is down -0.78% for the week. With the Fed’s interest rate decision looming today, the precious metals are likely to remain volatile until a direction is established. With both Gold and Silver in a strong bearish trend, any rallies are likely to attract new sellers into the market. However, if the Fed paints a hawkish picture on the interest rate hike cycle for subsequent hikes, Gold could start looking to push higher and could potentially pull up Silver prices as well.
Gold – Technical Outlook
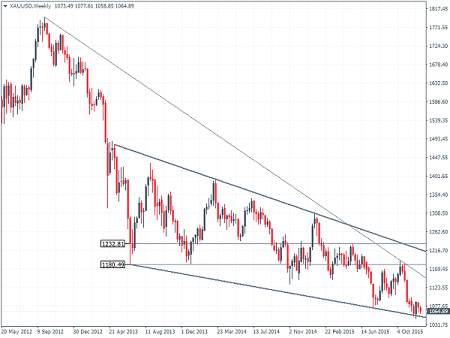
The weekly chart for Gold shows prices consolidating within the weekly range formed on the week of November 29th, 2015 where a bullish engulfing candlestick was formed. With prices ranging within these levels, Gold prices could be looking at a strong break out on a break above or below the engulfing candle’s high or low. Over the longer term, prices have narrowed down their range into a wedge pattern. Support/resistance near 1232.81 – 1180.49 will be of key interest as any possible upside breakout from the bullish engulfing weekly candlestick could see prices being capped near this key resistance level. To the downside, a break below the trend line connecting the lows of 23rd June 2013 and 19th July 2015 could signal more downside in Gold.

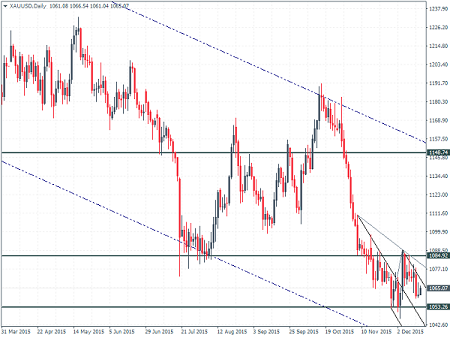
On the daily chart for Gold, prices have been trending within the falling price channel but have managed to move sideways within 1084 high and 1053 low. The median line plotted on the chart shows a possible move to the upside but would be confirmed on a break above 1073 level and preferably above 1084 level of resistance which held up on the initial test. A close above 1084 resistance could signal a possible move towards 1148 – 1150 region. Alternatively, failure to move higher could see Gold break below toe 1053 support which could turn very bearish for Gold prices.
Silver – Technical Outlook
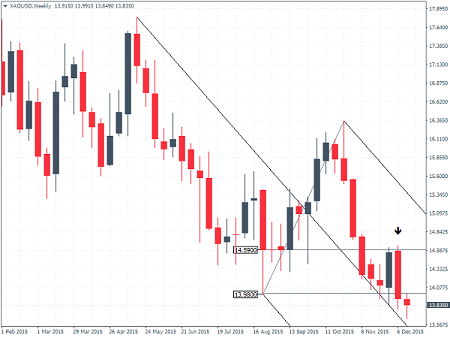
On the weekly charts for Silver, prices turned to a bearish engulfing candlestick on the weekly chart which could signal further weakness to the downside. The Median line plotted on the weekly chart shows Silver prices currently bouncing off while trading within the support/resistance level of 14.59 and 13.98. At the time of writing, Silver prices are currently bearish, but a weekly closer lower could signal further downside in store. Any near-term rallies in Silver prices are likely to be capped near 14.59 region.
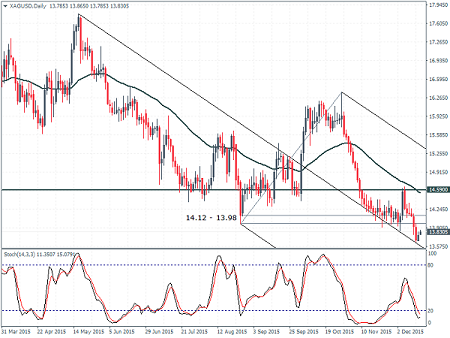
On the daily chart, the median line shows prices attempting to bounce off from the current levels. A potential retest to 14.12 – 13.98 is likely. If the resistance caps the rallies, Silver prices could possibly break the median line and continue to trend lower. However, in the event that prices break above 14.12, a test to 14.59 is very much a possibility. With prices trading below the 50 period moving average, only a convincing break above 14.59 and potentially above the 50 period moving average could signal further upside in Silver prices.