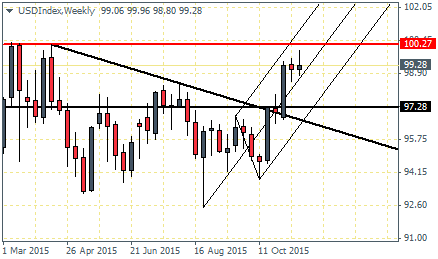
The US Dollar’s strong rally, now nearing 6-weeks is showing signs of exhaustion after prices were rejected near the highs of 98.85 earlier this week. With the 100 handle coming in as an important psychological resistance level the strong rally has so far failed to establish any near term support. This supports the view that a potential correction is due in the near term with a potential support zone established at 97.28, which was previously acting as a resistance level. The weekly chart below shows the possible reversal that could happen. Plotting the median line, a break of the median line off the current highs could confirm the downside view with a test to 97.28 being a strong likelihood.
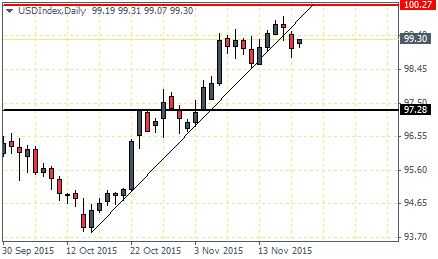
On the daily chart, the price declines started two days ago with a doji spinning top being formed earlier on Wednesday. Prices then gapped down lower in yesterday’s trading session, which could potentially mark the start of a runway gap in the descent to the downside. There is a minor support seen near 98.50 level which could offer a short term bounce in prices. The downside view could be further confirmed if the current retracement being seen manages to hold below the recent highs. A break lower could then see prices decline to the 97.28 support. This would mark the dip in the rally making it an ideal price level to go long from.

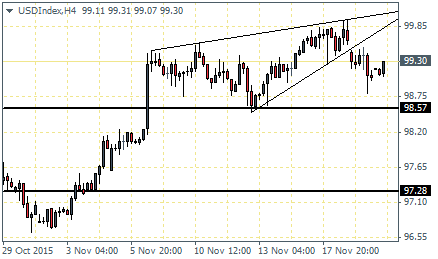
On the 4-hour chart for the US Dollar Index, the break out from the minor rising wedge pattern shows a current retracement back to the break out level. There is a possibility that prices could rally back to the previous unfilled gap near 99.63 ahead of the decline lower. Above 97.28, there is a minor support at 98.57, which shows confluence with the 98.85 region mentioned earlier. This minor support could keep the Dollar Index support for a short term ahead of a decline lower.
In terms of economic data, the US Dollar continues to remain supported against a hawkish Federal Reserve and a dovish ECB. Considering that the trade weighted index has a strong weightage to the Euro, even a short term sell off in the Euro could keep the Dollar Index well supported. The markets are currently expecting the Fed to hike rates at the December meeting, while at the same time, expect the ECB to expand on its massive bond purchase program alongside other conventional monetary policy measures including cutting the deposit rates further. With merely a few more weeks left into the major policy decision week, the US Dollar is likely to remain range bound. Within the time frame and in the run up to the December week of the ECB and the Fed meeting, a decline in the US Dollar to 97.28 will make for an ideal support level which could see prices eventually push above the 100 handle.
Of course, there is a risk that the 97.28 support could fail, in which case, we could expect the Greenback to decline sharply lower and post further losses.

