The precious metals markets are attempting to recover after nearly a few straight weeks of declines. Gold prices touched a weekly low at 1066.5, while Silver dropped to 13.89, both posting nearly a 5 year low across the board. Yesterday, Gold and Silver managed to post a strong rally, recovering off the lows and in the process rising for two consecutive days. With the markets starting to price in the Fed rate hike in December, the declines in the precious metals markets also reflect the same.
Gold – Technical Outlook
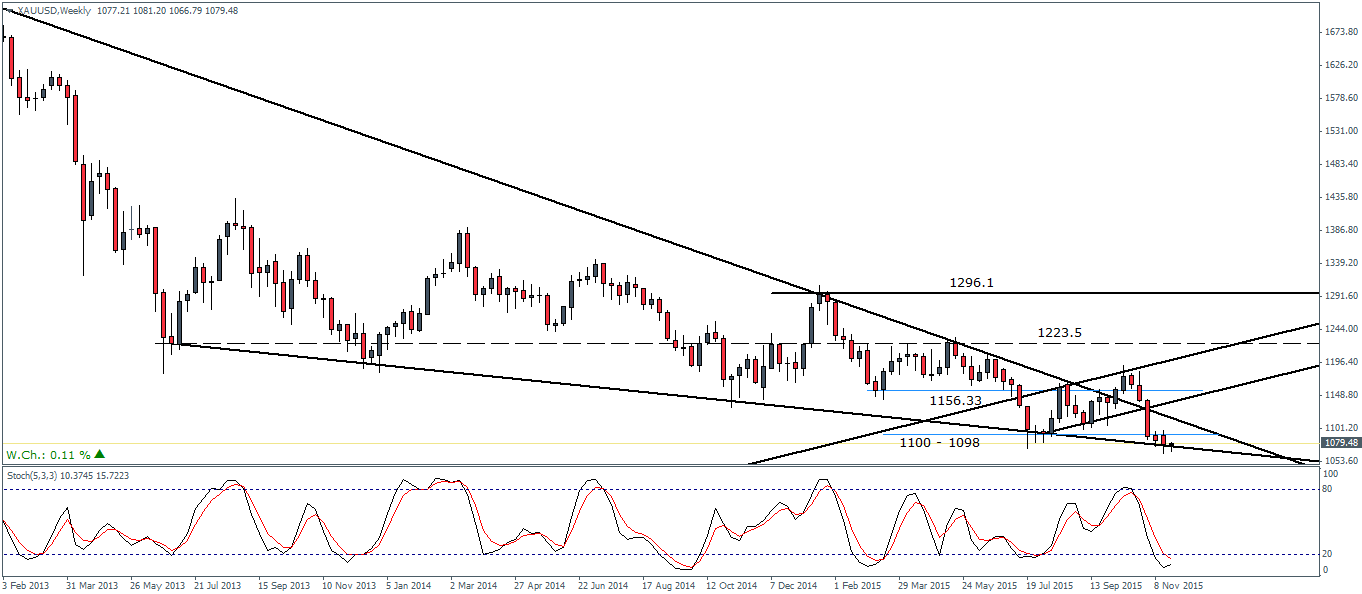
On the weekly chart, Gold remains bearish with no hints of any possible correction to the upside. However, prices have been rejected near the trend line connecting the lows from 30th June 2016 at 1223.5 and 2nd August 2015 at 1093.45. The dynamic support offered by the trend line is likely to keep prices supported in the near term. To the upside, 1100 – 1098 remains a very likely price level which could be tested for resistance. However, the strong consolidation up ahead, points to an imminent break out in Gold in the near term. Above 1100, the next price target in question will be 1156 which was a previously broken support level and one which could be tested for resistance.

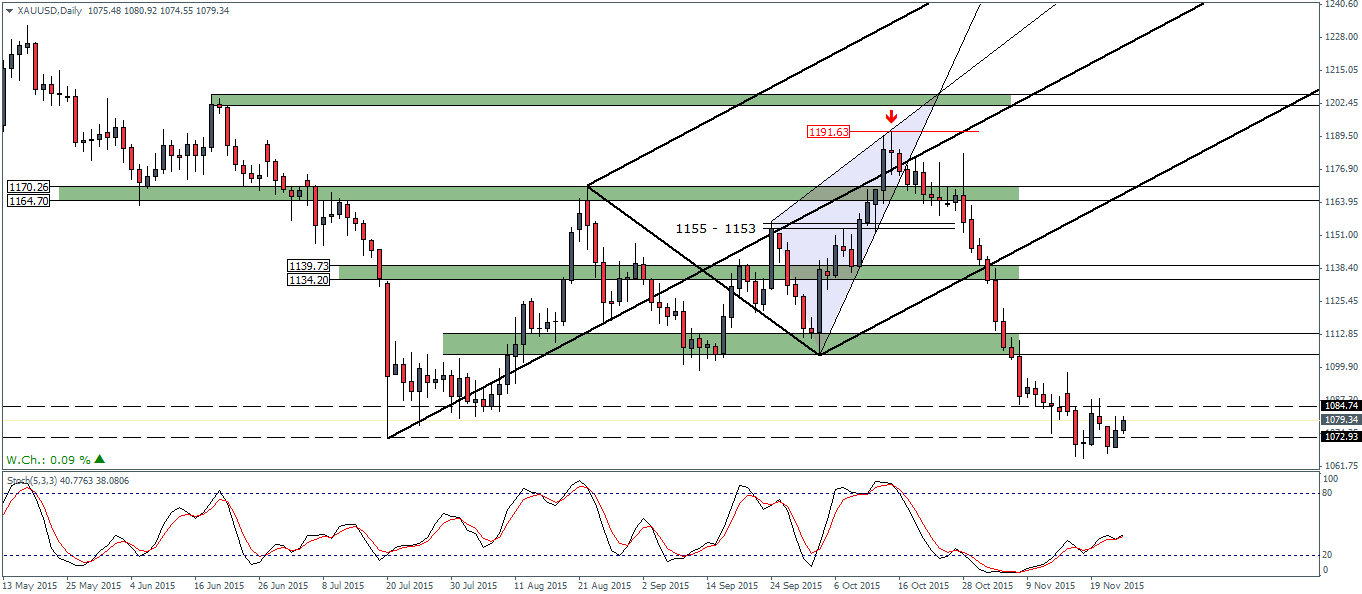
On the daily chart time frame, Gold looks to have established a bottom below 1072 region with prices being rejected multiple times. A bullish close above 1084 marking the support zone would indicate of a potential move to the upside with 1100 coming in as the first level of resistance that can be tested. The Stochastics oscillator on the daily chart remains weak and the momentum is biased to the downside, however, a new low is likely to be formed at this level, which could signal a bullish correction to the upside.
Silver – Technical Outlook
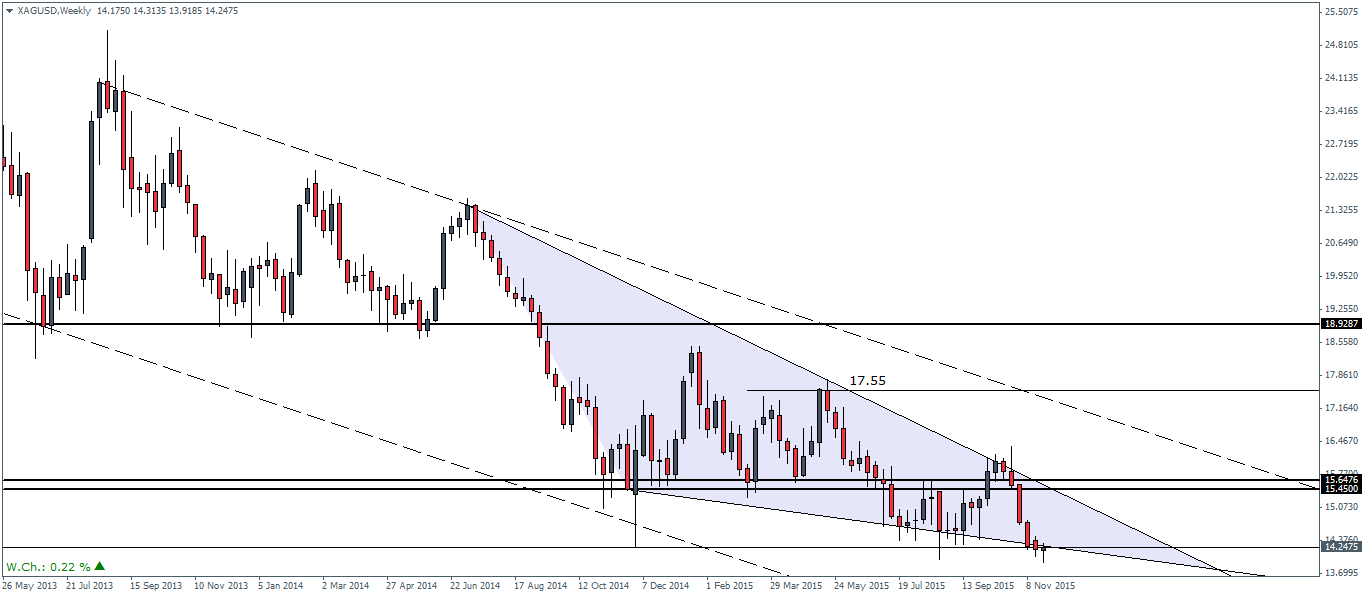
Silver prices are also well supported by the trend line within the larger descending triangle pattern. The current weekly candlestick could potentially signal a change of trend if we see a bullish close this week. The upside bias would be even more strengthened if we see a bullish close above last week’s open at 14.39. In Silver, the most likely rally will see a test back to 15.45 level of support/resistance.
On the daily chart, Silver prices remain range bound above 14.12 region, an area that was previously identified as the most likely support level to hold prices. The daily chart shows the potential double bottom being formed at this level, but for the double bottom to be validated, a breakout above 15.64 would be required.
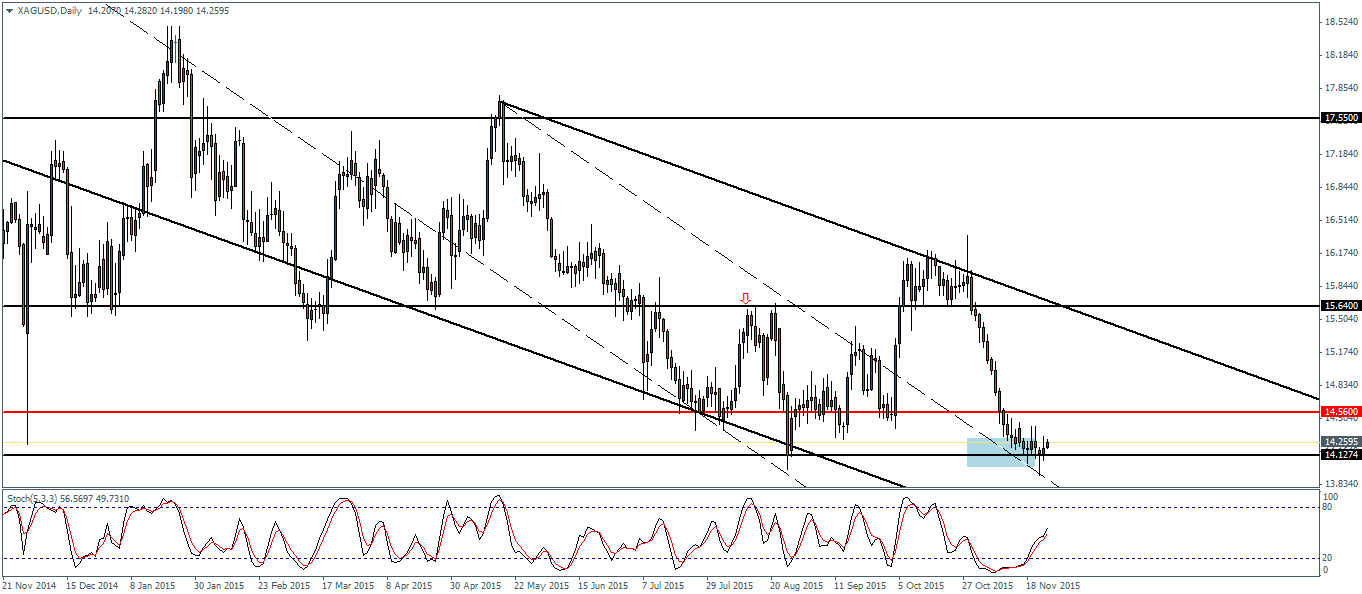
The Stochastics oscillator does not yet point to any correction as of now, and we suspect prices are likely to test the short term resistance at 14.56 before a new decline back to 14.12 is formed.

