
Summary: From last week’s precious metals analysis, Gold prices declined from 1170 as expected but the bearish momentum saw prices drop sharply below the intended 1150 to currently trade at 1110. Silver prices corrected to 15.2/15.1 as mentioned in last week’s analysis. Prices remain wobbly ahead of today’s NFP report, which is the main risk event for the precious metals.
The precious metals declined strongly this week with Gold futures currently down -2.88% while Silver prices are down -3.26%. The declines in the precious metals come as the markets start to price in the potential Fed rate hike in December. Over the week, Janet Yellen testified to the Senate Banking Committee and noted that the Fed will decide whether to hike rates or not at the December meeting. She did however mention that the rate hike decision would be data dependent. However, considering that December poses a potential risk for interest rate hikes, the fed funds futures probability has increased sharply ever since sending the precious metals prices lower.
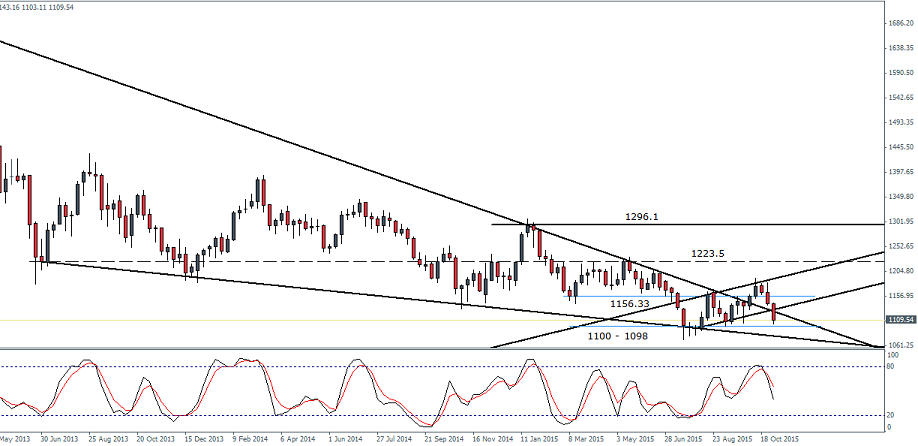
From a technical outlook, Gold is currently very bearish on the weekly chart, having broken the 1156 level of support/resistance and is now trading close to the 1100/1098 lower support. If this support holds, Gold could see a short term bounce, but the bias remains neutral unless 1156 turns back to support. In the event that prices close on a bearish note close to below 1100/1098 level of support, Gold futures could see further declines in the coming weeks.

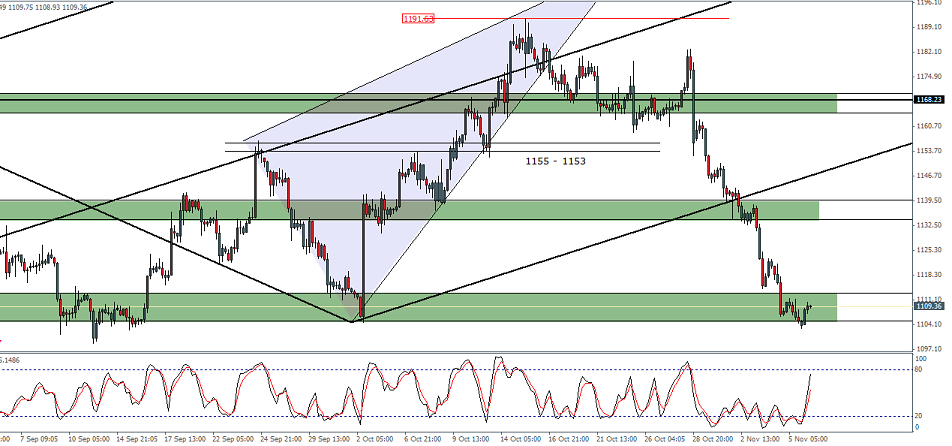
On the 4-hour chart time frame, prices declined to find support near the 1112/1115 through 1105/1100 region of major support. Price needs to rally above this zone in order to keep any bias for a move to the upside alive. Resistance at 1132/1140 will be the next level of interest to the upside. The Stochastics oscillator has been trending strongly in the oversold level but we expect to see another low being made in prices. If the Stochastics points to a divergence by printing a higher low here, a correction to 1148/1150 could be inevitable. To the downside, if prices decline off the current support zone, then a break below 1100 could see a potential longer term decline to retest previous lows at 1000.
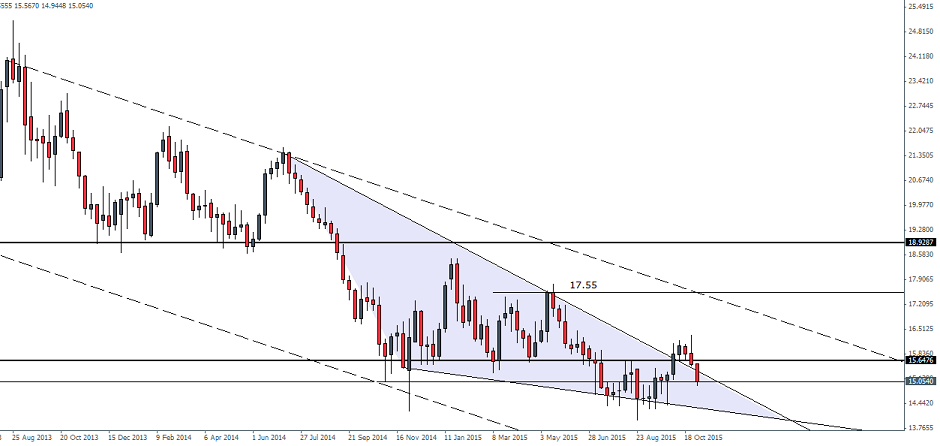
Silver prices have turned around after failing to establish support at 15.65 region and the prices are likely to retest the previous lows at 14.6/14.5 region. As long as the lows are not breached, Silver prices could see another attempt to rally but the upside remains limited as long as 15.65 remains as resistance. In the event of a break higher, then 15.65 could see a test of support which will then see a rally to 17.55 which will mark the retest of the next main resistance level.
On the Daily chart for Silver, prices have completed the correction to 15.2/15.1 level of support which marks the previous break out from the falling price channel. To the downside 14.56 remains a level of interest. A test of support here could still keep the bias to the upside, but scope of further rallies remains limited. 15.64 resistance level will likely act to keep prices subdued.
The Stochastics oscillator has been in a strongly oversold level for the past few daily sessions and it points to a possible sideways price action between 15.64 through 14.56 levels in the coming weeks.
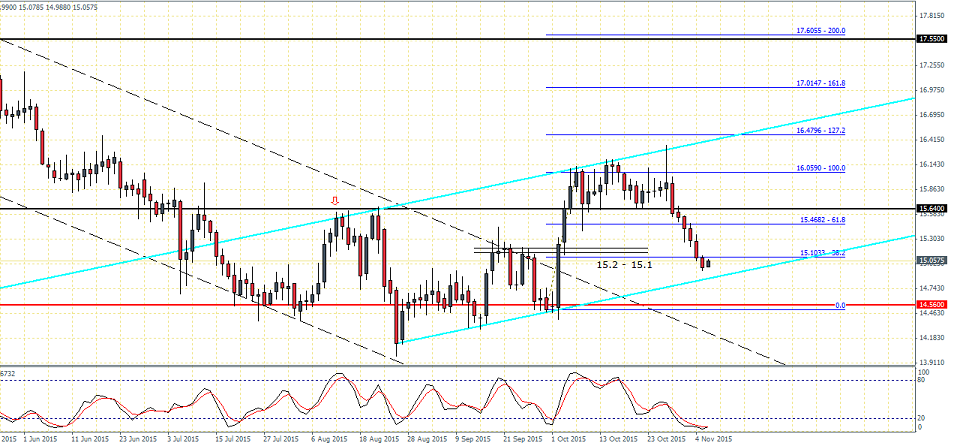
The new rising price channel shows resistance at 15.65 through 15.50 which could be tested if the trend line of the price channel manages to act as dynamic support.

