
Crude Oil futures poised for a weekly gain
Crude Oil futures are poised to make a second consecutive week of gains after prices formed a small bodied candlestick pattern last week. Currently up 3.78% for the week, Crude Oil got a temporary boost with escalating geo-political conflict in Syria and also comments from OPEC’s largest Oil producer, Saudi Arabia which earlier this week commented that the nation was ready to negotiate with non-OPEC producers to stabilize Oil prices. While Oil managed to gain ground on the comments, the comments were met with skepticism as some non-OPEC countries questioned if Saudi Arabia would be able to meet its commitment. Being a staunch Oil producer which has led to the current slump in the Oil markets, the upcoming OPEC meetings are likely to see Crude Oil turn volatile during the event.
Yesterday’s weekly Crude Oil inventories report showed that the weekly stockpiles increased by 1 million barrels last week, keeping the total commercial US Crude Oil supplies at 488.2 million barrels, which still remains near a 80-year high. Earlier this week, on Tuesday, the American Petroleum Institute (API) reported that the Crude oil inventories had increased by 2.6 million barrels, beating analyst estimates of a 1.1 million increase in inventory.
Crude Oil Technical Analysis

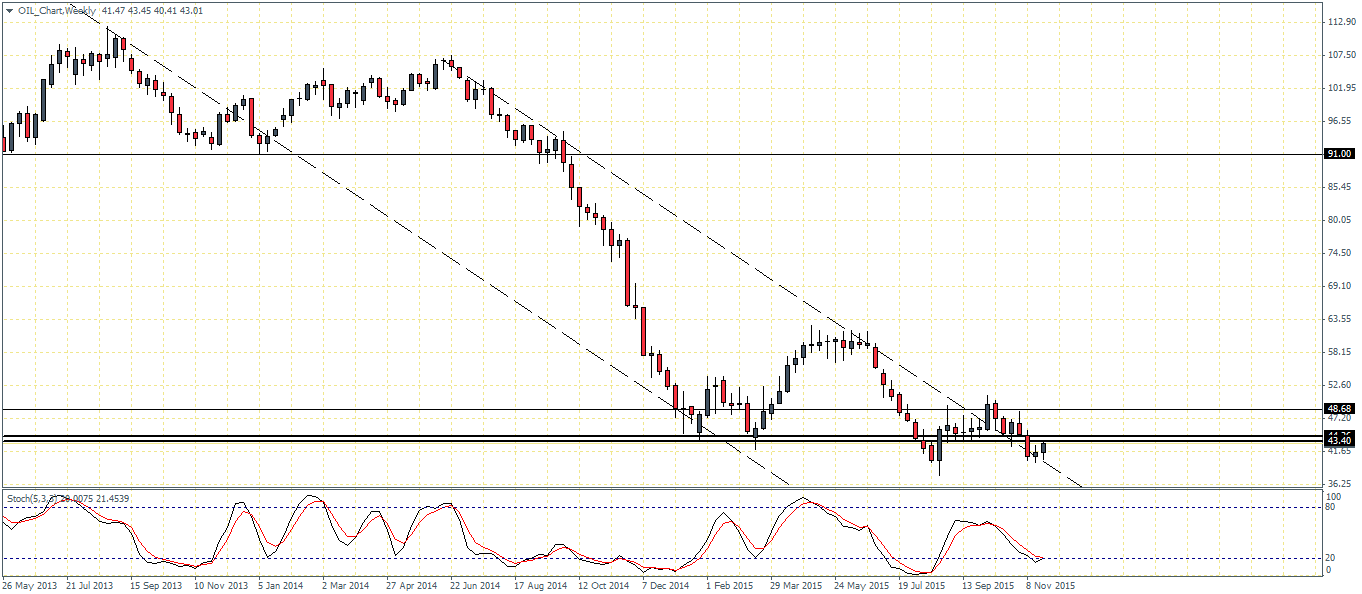
From the technical charts, a bullish close on the weekly could potentially risk a move to the upside with a test to $48.86 region of resistance likely to come into focus. However, there is a risk of a possible fake break out to the upside, which could see prices retest the break out and if failing to hold above $41.60, further declines could be in store. The Stochastics oscillator is currently printing a higher low and the bullish divergence points to a longer term correction. A break above $43.5 could no doubt see prices test $48.86.
On the daily charts, Crude oil still remains bearish considering the lower highs and lower lows being formed on the charts. The current retracement is likely to stall near the previous lows at $43.40 through $44.26. If this level of previous support is established as resistance, Crude Oil is likely to decline further on a break below the recent lows at $40.66.
Considering that the Stochastics on the daily time frame is in the overbought level, a potential decline down to $41.60 through $40.66 looks the most likely scenario.
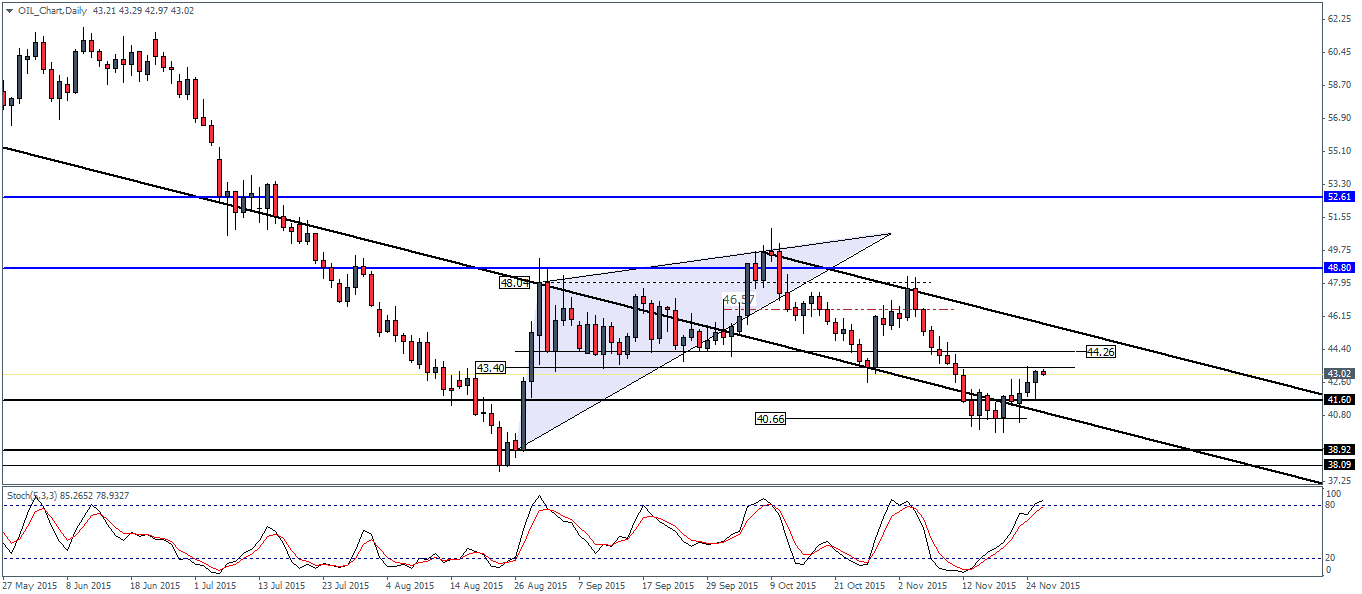
In summary, while Crude Oil futures are looking bullish, a new lower low is likely to be formed, if prices manage to establish resistance near $43.40 – $44.26 and will be confirmed by a break below the previous lower low at $40.66. This should significantly cause a bullish divergence on the Stochastics daily time frame signaling a larger correction higher.

