Gold prices have gained as much as over 1.0% this week after prices fell to the lows of 1104 last week. At the time of writing, Gold is trading near the highs of 1150. The gains in Gold prices come as the markets remain uncertain on the US Federal Reserve’s interest rate hike plans. Gold is expected to remain range bound until at the very least, the Fed’s rate hike plans are more certain. Price action in Gold in the near medium term is likely to range between the 1200 pivot and the 1000 levels of support/resistance.
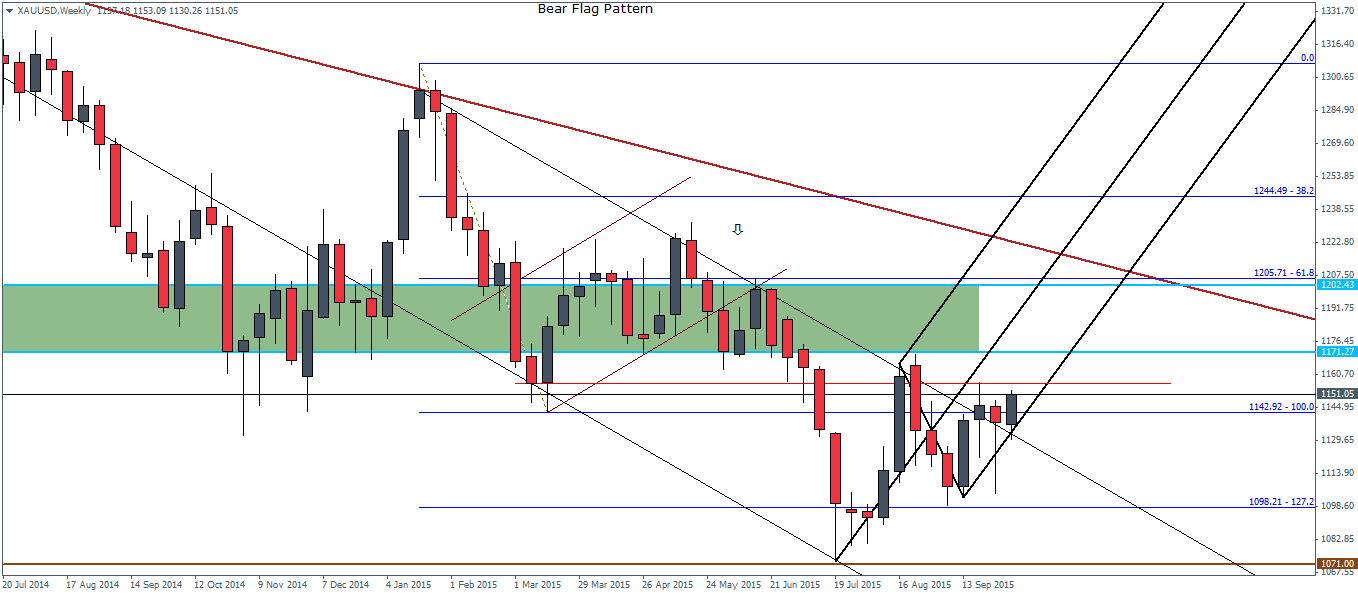
The weekly chart, at the time of writing is currently posting a bullish engulfing candle pattern. A weekly close above 1145 or 1148 will confirm this view with the next likely target being 1170 and eventually the 1200 handle. The first chart below shows the weekly price action where prices fell below the main support level of 1200 after forming a descending triangle pattern. The current rally towards 1200 could potentially mark a test of resistance at 1200 which could confirm the larger move to the downside. Prices are trading comfortably within the rising median line plotted and the upside bias could be confirmed on a close above 1156.33, or the bullish engulfing candle confirmation.
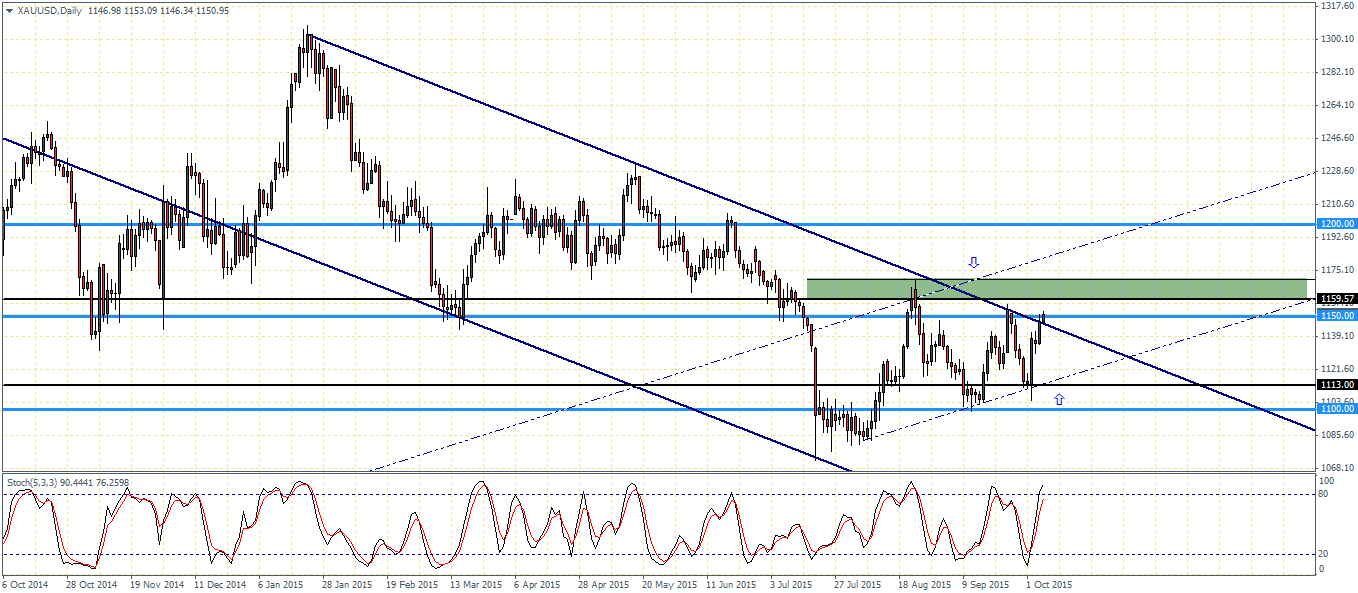
On the daily charts, the price action is a bit more clear as we notice the price levels of 1170.26 and 1160 most likely to offer a short term resistance. The Stochastics oscillator hasn’t yet signaled any divergence while price managed to break out of the larger falling price channel. It will be interesting to see how Gold reacts to the resistance level within the minor rising price channel. Failure to clear 1160 could potentially see Gold decline back into the main descending price channel with the next support coming in at 1113 region.

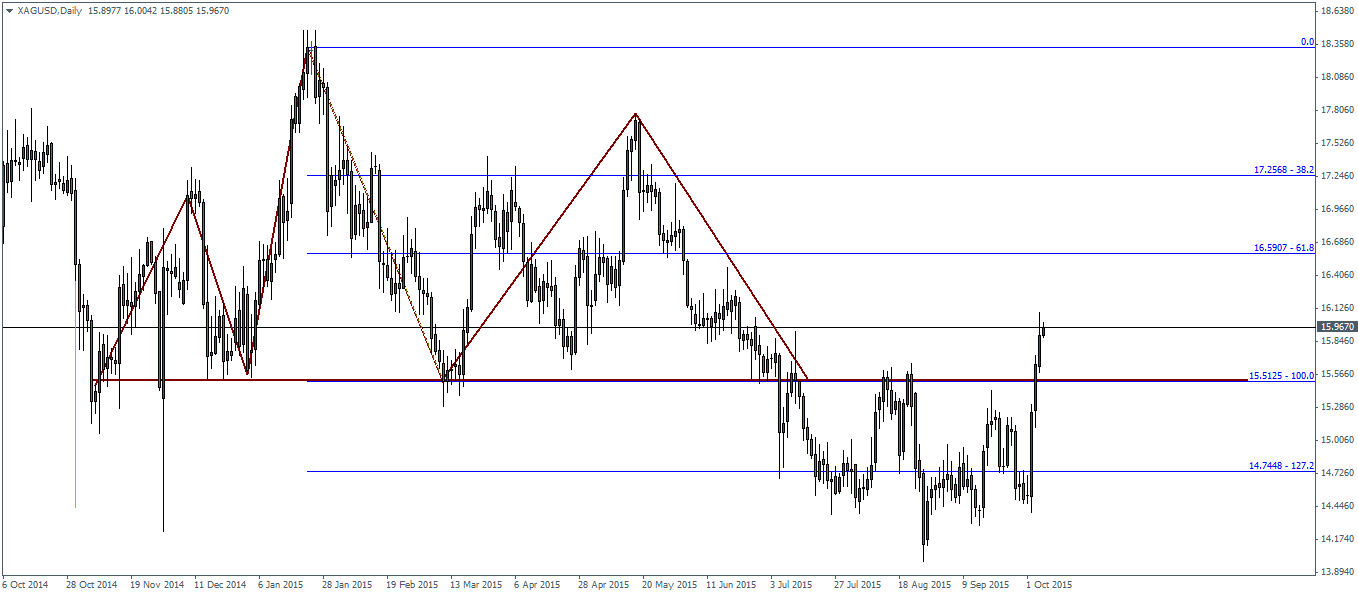
Silver prices have been more bullish than anticipated, with the weekly gains to date posting a 4.50% gains. On the daily chart, the head and shoulders pattern now stands invalidated with prices reversing near the 127.2% Fib level of 14.75 and the strong rally closing back above the head and shoulder’s neckline of 15.51. We can anticipate the price level of 15.51 to be tested for support in the near term, in which case, Silver could potentially look to book higher gains.
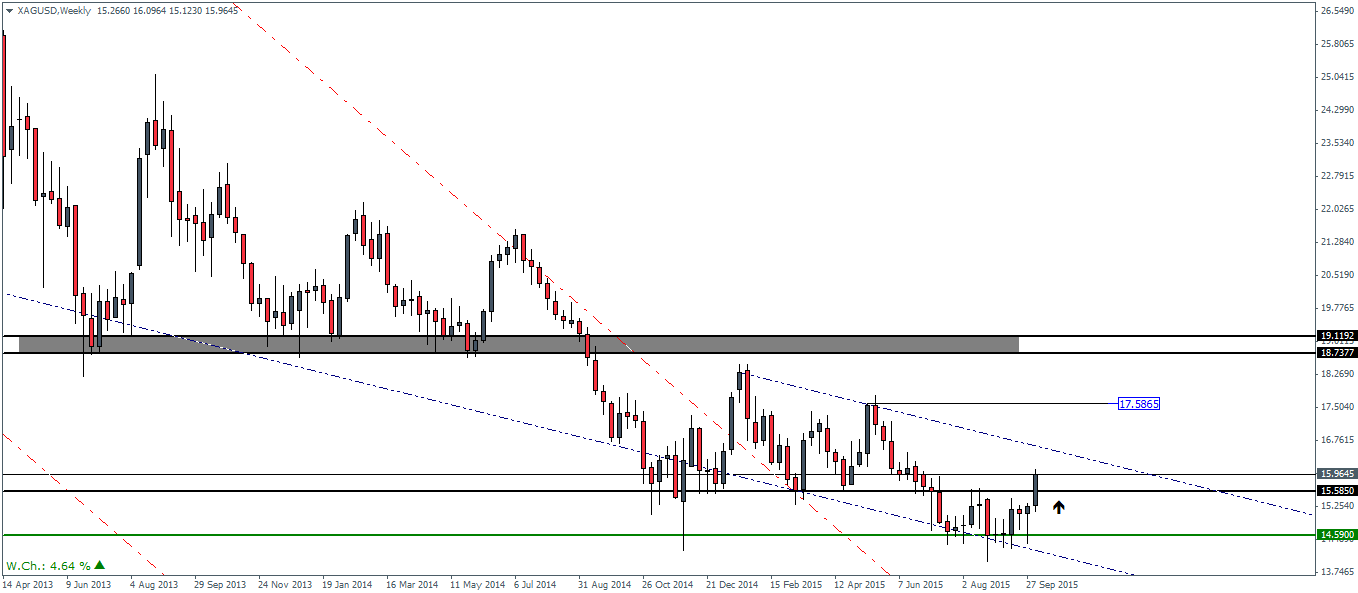
Looking to the weekly charts, Silver’s price action looks very bullish with prices being rejected near the lows of 14.59 forming two weekly hammer patterns. If Silver prices close above 15.58 this week, we could expect support to be established here with further upside in store, on break of the minor falling price channel. The next main resistance in Silver is at 17.58. With prices well supported above 15.58 and 14.59, we could expect Silver to gain ground in the near term with a confirmation on break of the declining price channel.