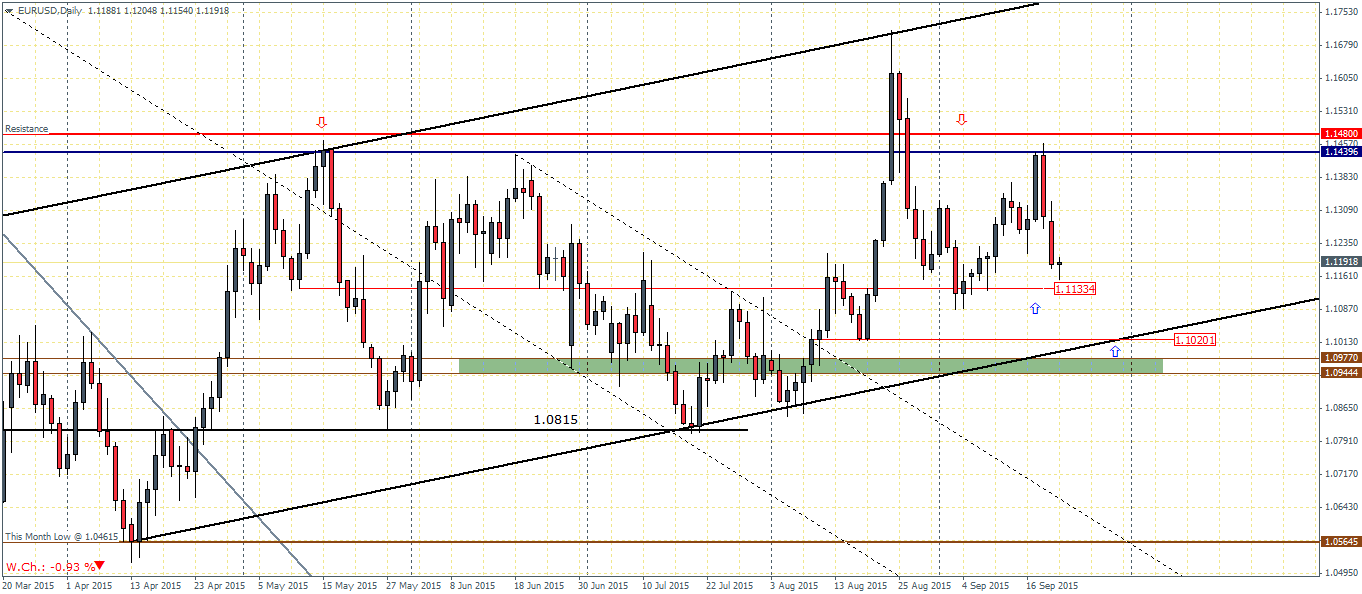
EURUSD (1.11): EURUSD has established firm resistance near 1.148 – 1.144 region. The rally off the FOMC meeting last week saw prices failing to break above the resistance level and resulting in a steep decline. Technical support comes in at 1.1133 followed by 1.102. As such any bounces in the short term will likely see new sellers enter the market in a bid to push EURUSD lower. The main level of support to watch for will be 1.102 region. A break below this support could see prices break the larger rising price channel which could see a new leg in the long term bearish trend resume. A close below 1.102 could see a brief test of support at 1.09 region, failing which EURUSD could possibly decline to previous lows. Alternatively, if the support at 1.102 holds, we could expect prices to range sideways for a considerable period of time.
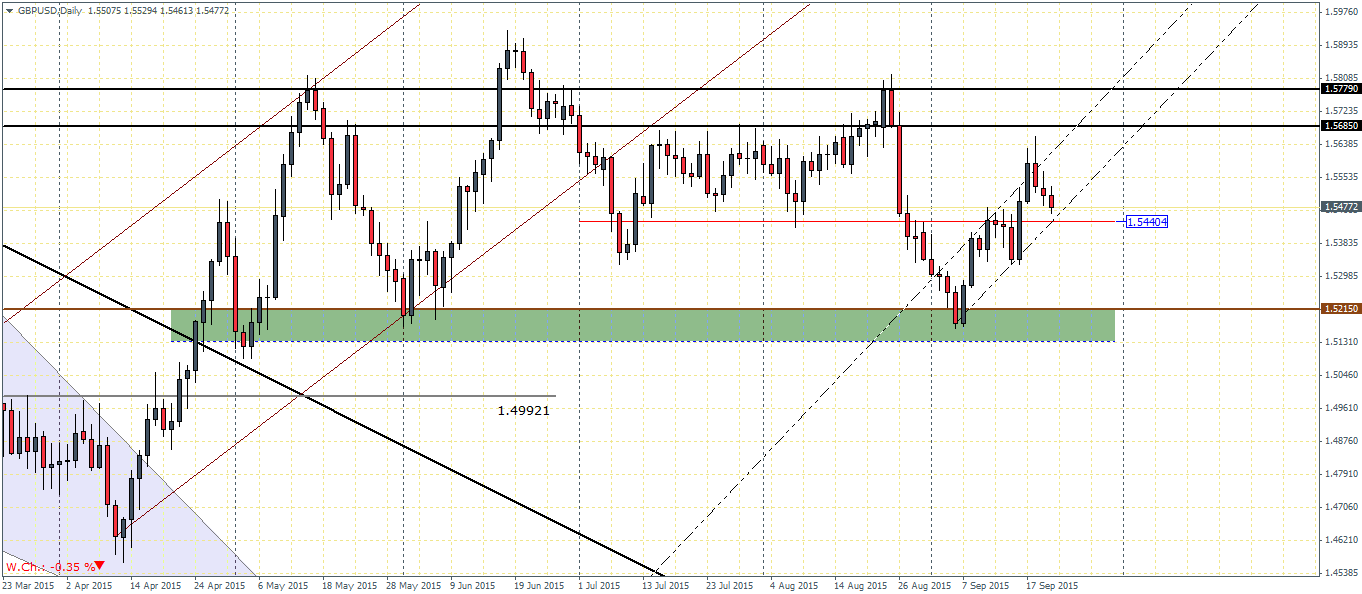
GBPUSD (1.54): GBPUSD formed a dark cloud cover candlestick pattern few days ago and remains biased to the downside. Technical support comes in at 1.544 region which could offer some short term support, but a break of this support looks evident. The next lower support level comes in at 1.5215. Plotting a minor rising price channel to the most recent price action, the support at 1.544 looks evident to offer some support in the near term. However, a breakdown of prices off the rising price channel could trigger further downside weakness in the store. Prices look to be well supported between 1.5215 – 1.5132 region.

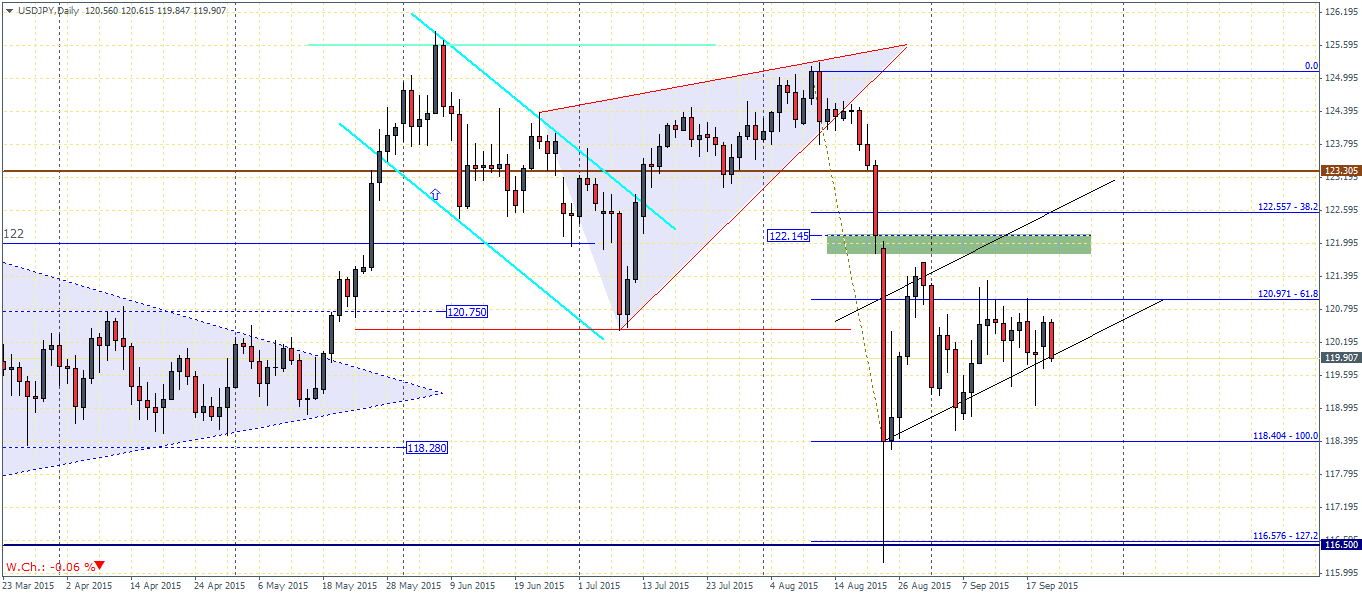
USDJPY (119): USDJPY formed a large bearish flag pattern after breaking out from the ascending triangle/wedge chart pattern. With prices trading below the main resistance level of 123.3, a break down below could see prices test the previous lows at 118.4, followed by 116.58. In the likely event that either of these support levels will hold the declines, USDJPY could remain range bound in the short term ahead of further declines lower. To the upside, price needs to clear the short term resistance at 120.97.
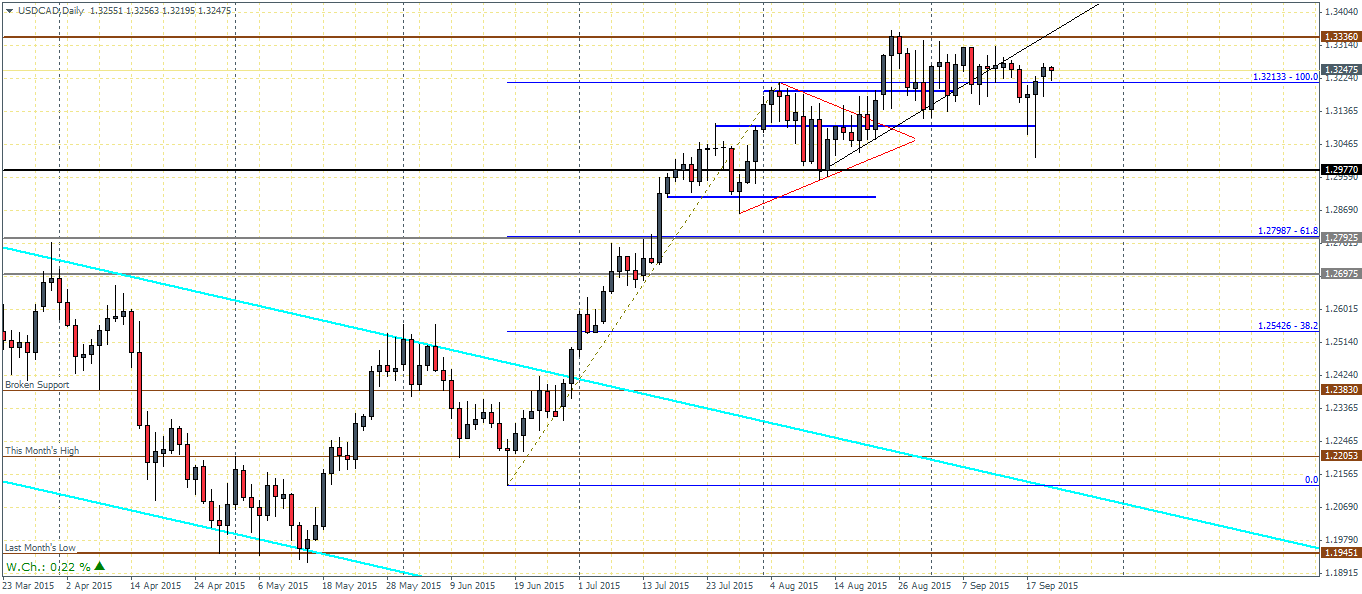
USDCAD (1.32): USDCAD remains range bound on the daily charts but the bias remains to the upside. We notice a brief retest of the break out of the bullish pennant pattern few days ago. If prices manage to clear 1.3336 level of resistance, USDCAD could be poised for a further rally with the potential to post new yearly highs at 1.3884 level. However, it is advisable to be cautious on USDCAD as the minor trend line connecting the lows of 12th August and 31st August has been broken and with resistance looming at 1.3336, we could expect to see a decline lower if prices fail to break higher. To the downside, support at 1.2977 is one to watch for.
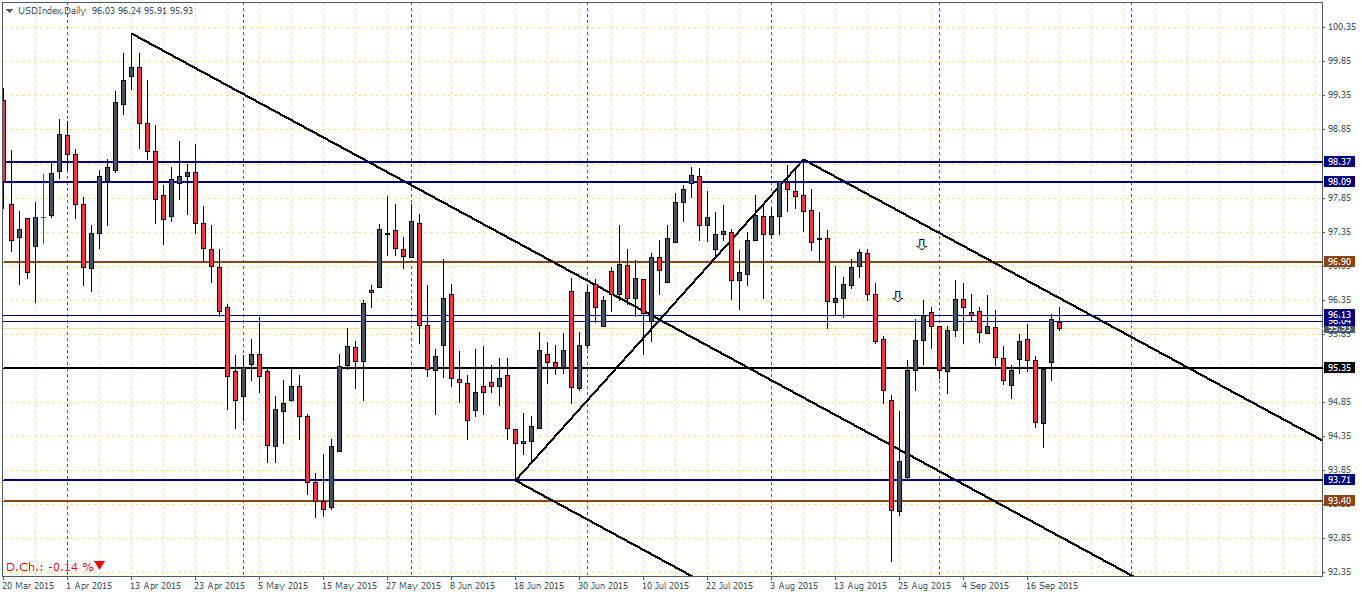
US Dollar Index (95.95): The US Dollar index saw a rally of the lows at 94.35 but is currently struggling to break the resistance at 96.13. A bearish close here could potentially trigger further downside in the US Dollar. 95.35 will be the level to watch for as a break below this price level could signal the bearish declines which could see the US Dollar Index test previous lows below 93.40. To the upside, a break out above 96.13 will see a potential rally in the US Dollar index as far as testing the next main resistance at 98.