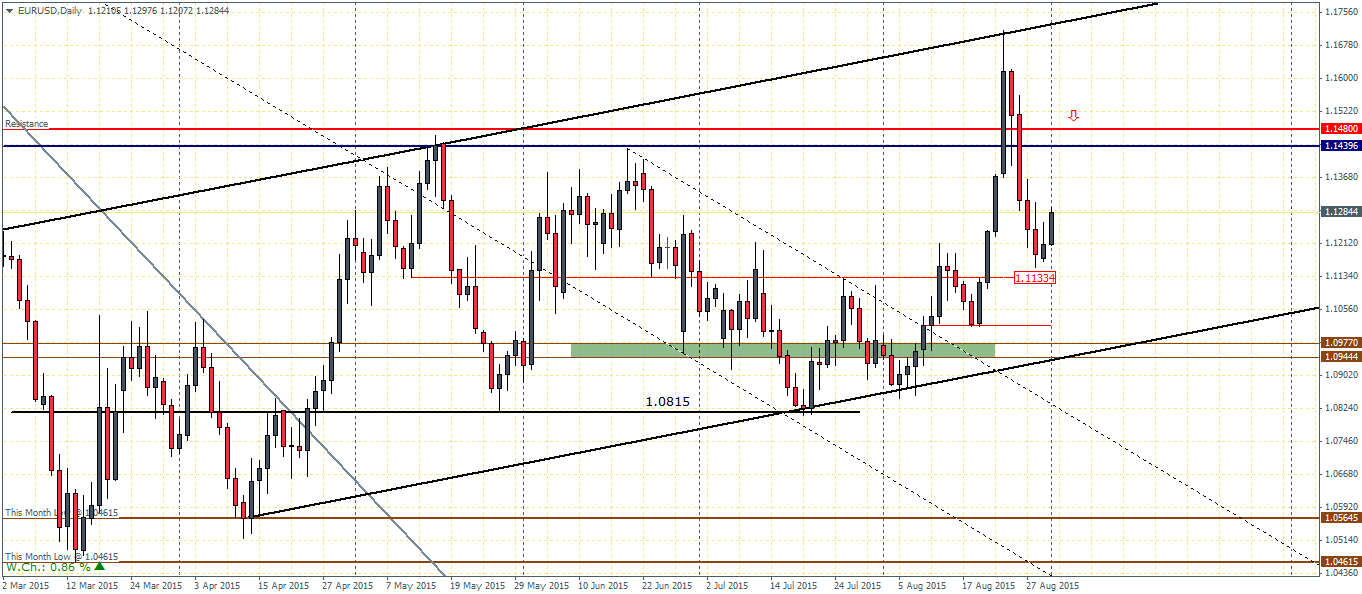
EURUSD (1.12): The declines off the multi-month highs above 1.1678 saw a sharp selloff in EURUSD. However prices stalled just a few pips above 1.1133 and looking to reverse. A bullish close today could confirm this upside bias which will see EURUSD potentially test the level between 1.148 – 1.1439 for resistance. A successful test of resistance at this level could see renewed bearish declines in EURUSD which could potentially fall towards 1.1133 level. Alternatively, a continued bullish momentum could break the resistance above 1.148 in which case a break above the previous highs at 1.1678 could be a possibility.
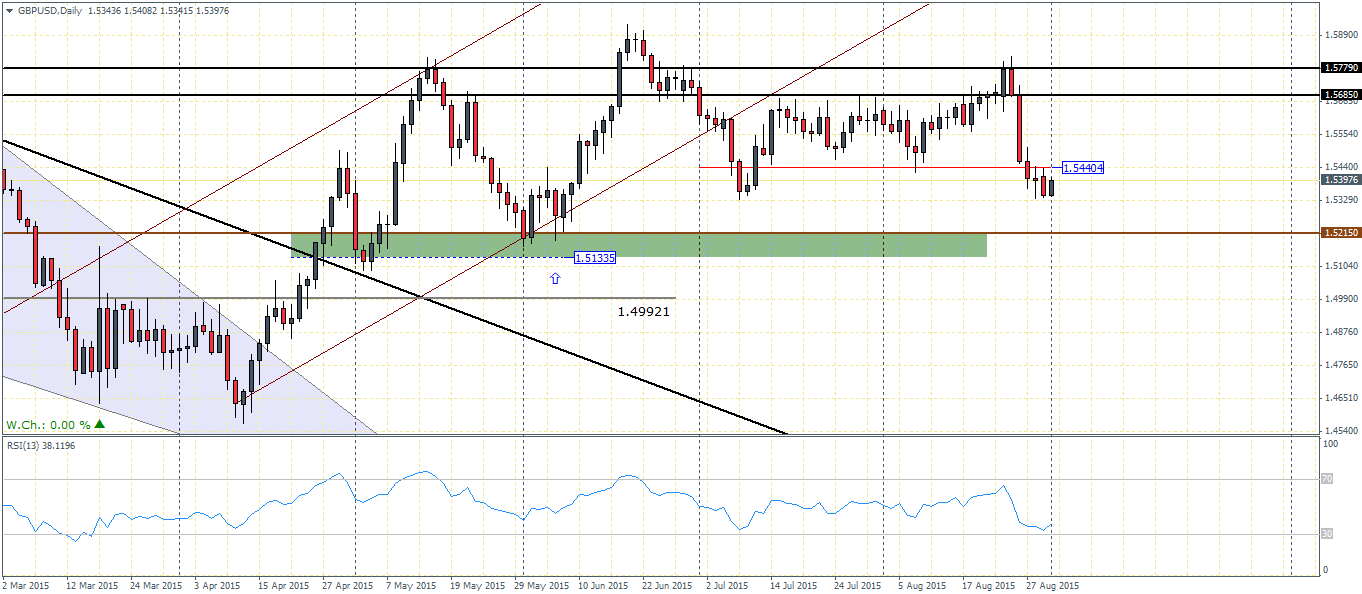
GBPUSD (1.54): The resistance between 1.5779 and 1.5685 saw GBPUSD break the sideways range below 1.544 range low. Price is looking to retest this break out level and could possibly climb back above 1.544. In this scenario, if 1.544 turns to support, GBPUSD could yet again attempt to test the previous resistance noted. To the downside, a decline to 1.5215 could complete a retest to the support level. In the event that GBPUSD falls below 1.5215, we could anticipate a steeper decline towards 1.4992.

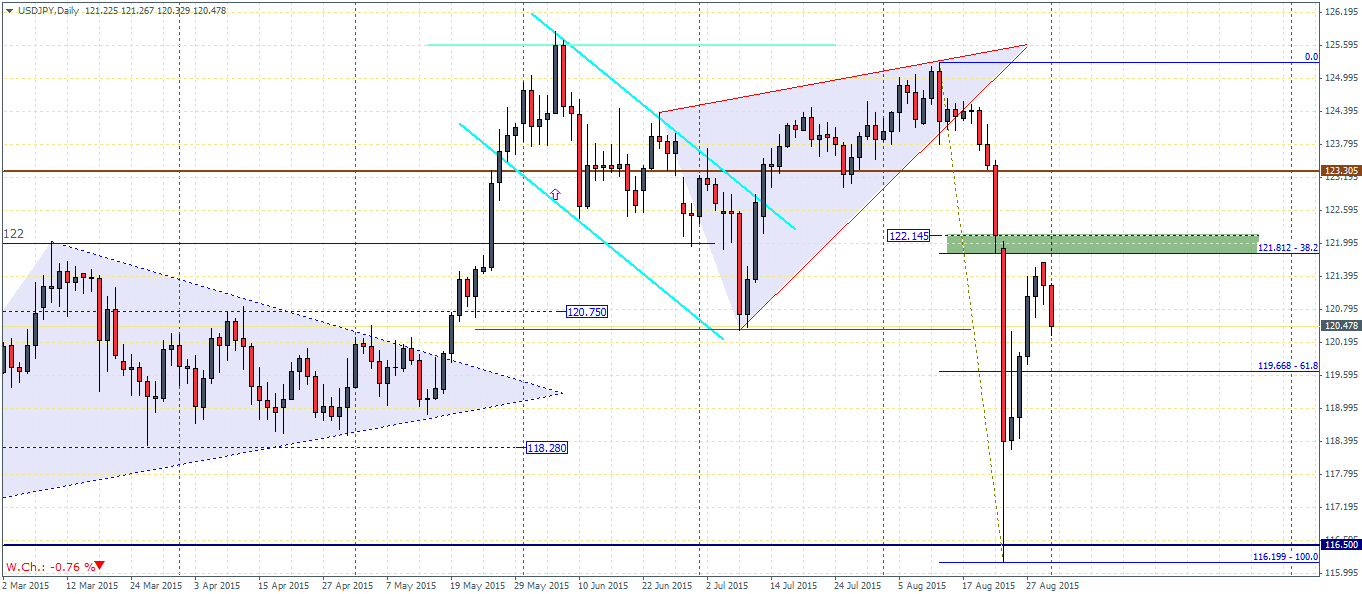
USDJPY (120.5): After falling to the lows near 116.2, USDJPY retraced most of the declines but the current daily candlestick charts shows a possible bearish reversal pattern which needs to be confirmed with a bearish close today. In such a scenario, USDJPY could see some renewed bearish momentum take shape and could potentially decline back to the previous lows with support near 116.50. Ahead of the declines to 116.50, minor support comes in at 118.28 which could offer some short term bounce in the markets. There is also a risk of an unfilled gap at 122.145 which sits just above the 38.2% Fib level at 121.812. Therefore, USDJPY could see a potential rally back to this level ahead of the declines.
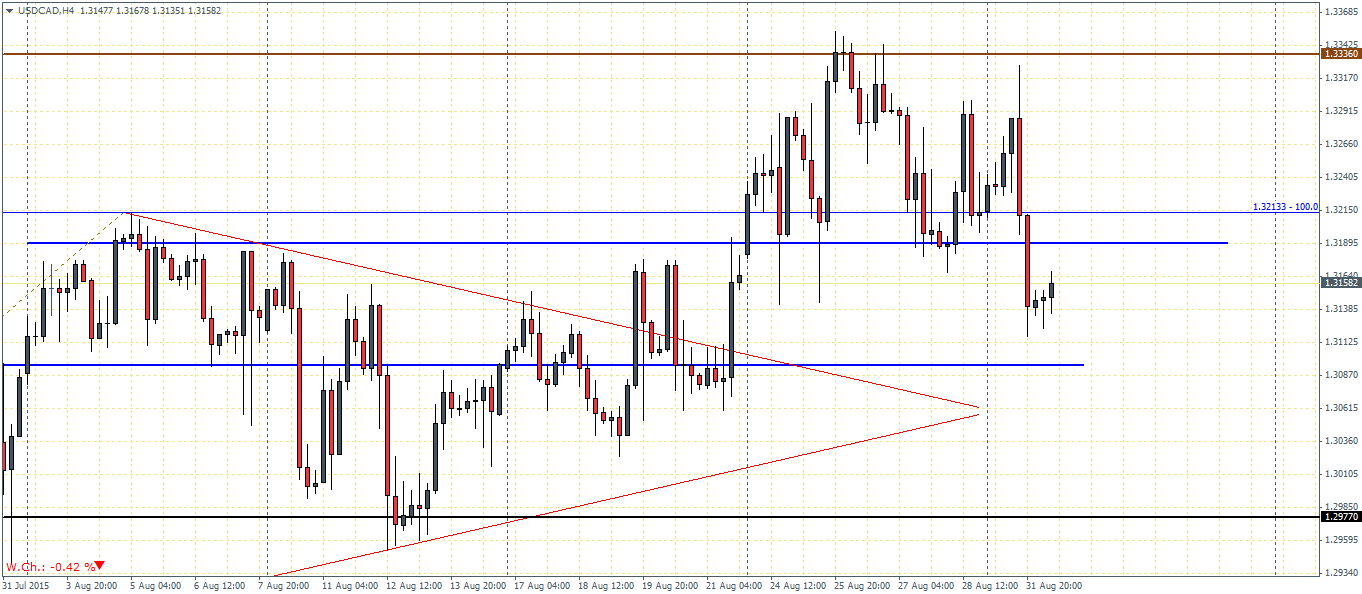
USDCAD (1.316): USDCAD has formed strong resistance near 1.3336 and has recently broken below the lows of 1.3189. A retest to the broken support at 1.3189 is likely to be tested for resistance. If the rally is held at resistance, USDCAD could fall to 1.3095 which is the next major support. The upside bias will need to be established only after prices break above 1.3213. We could therefore expect to see some sideways price action take place ahead of a potential break out. To the upside, USDCAD will need to rise above 1.32133 in order to retest the resistance at 1.3336 while to the downside a break below 1.3095 will see a decline to 1.2977
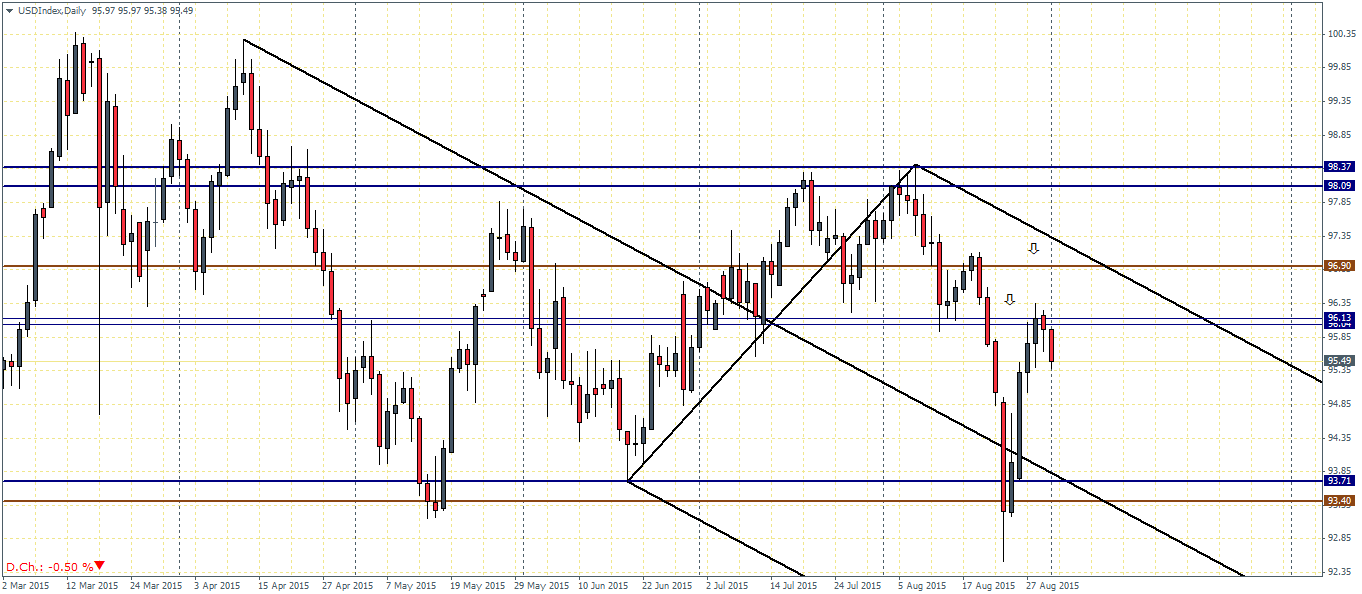
US Dollar Index (95.5): Price action in the US Dollar index is turning bearish after failure to break above 96.13 level of support/resistance. A bearish close today on the daily candlestick could confirm the downside bias in which case an imminent decline to the lower support at 93.71 – 93.4 is very likely. However, there is a possibility that we could see a reversal midway instead of falling to the lower support. To the upside, resistance at 96.13 needs to be broken in order for the Dollar index to test the next major resistance at 96.90