
Gold falls from record
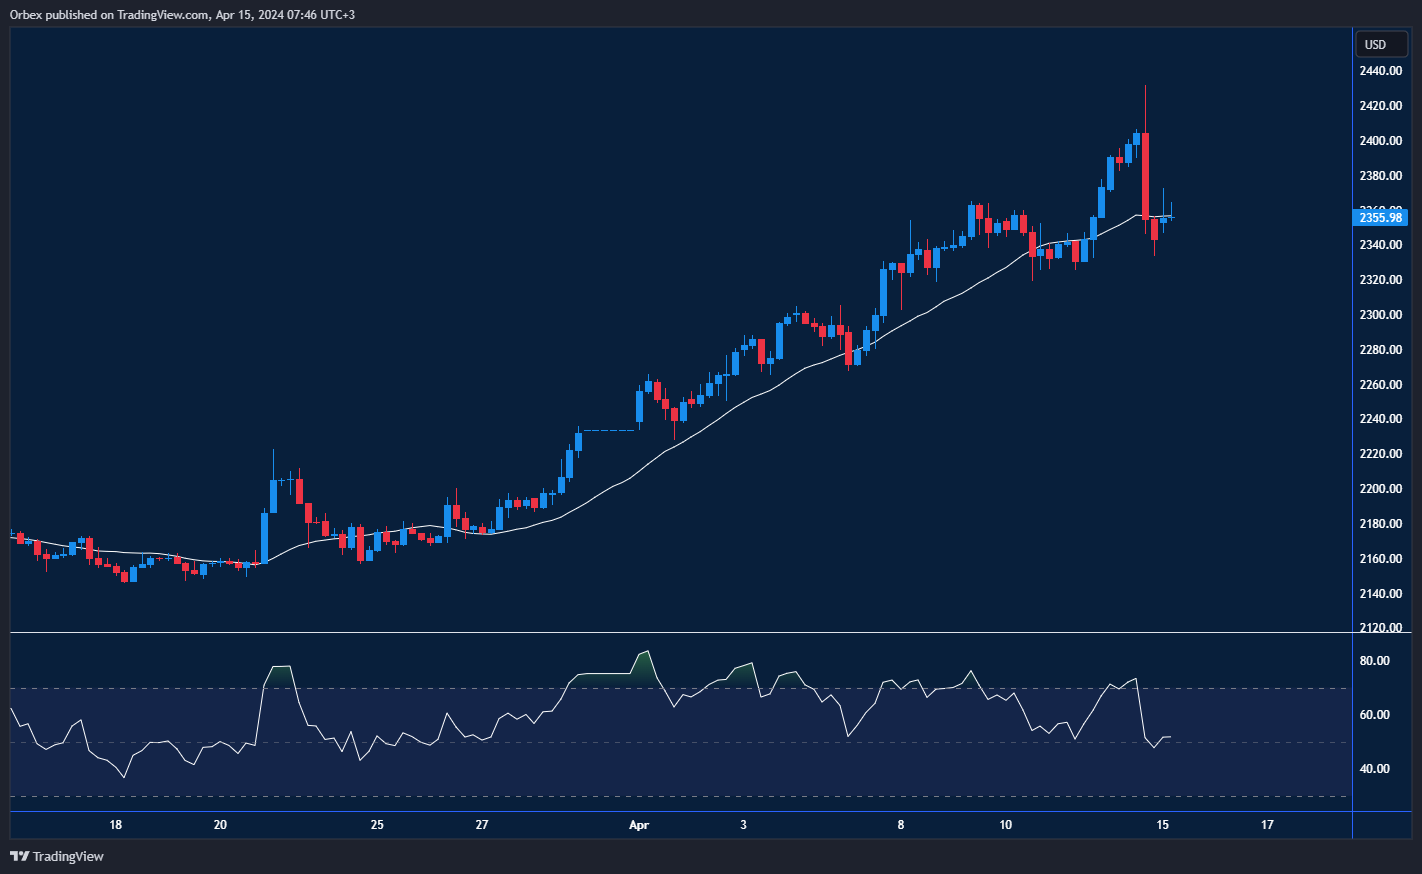
Gold falls as ongoing tensions first saw a fresh record above 2430. Then, a dramatic sell-off saw a dive towards 2300 as traders use the wait-and-see approach for the next move in the market. Successive breaks above the level of 2350 could see bulls re-enter the uptrend. 2400 is the first hurdle should the price bounce back. Otherwise, 2330 is the first support for the yellow metal.
GBPUSD attempts to rebound
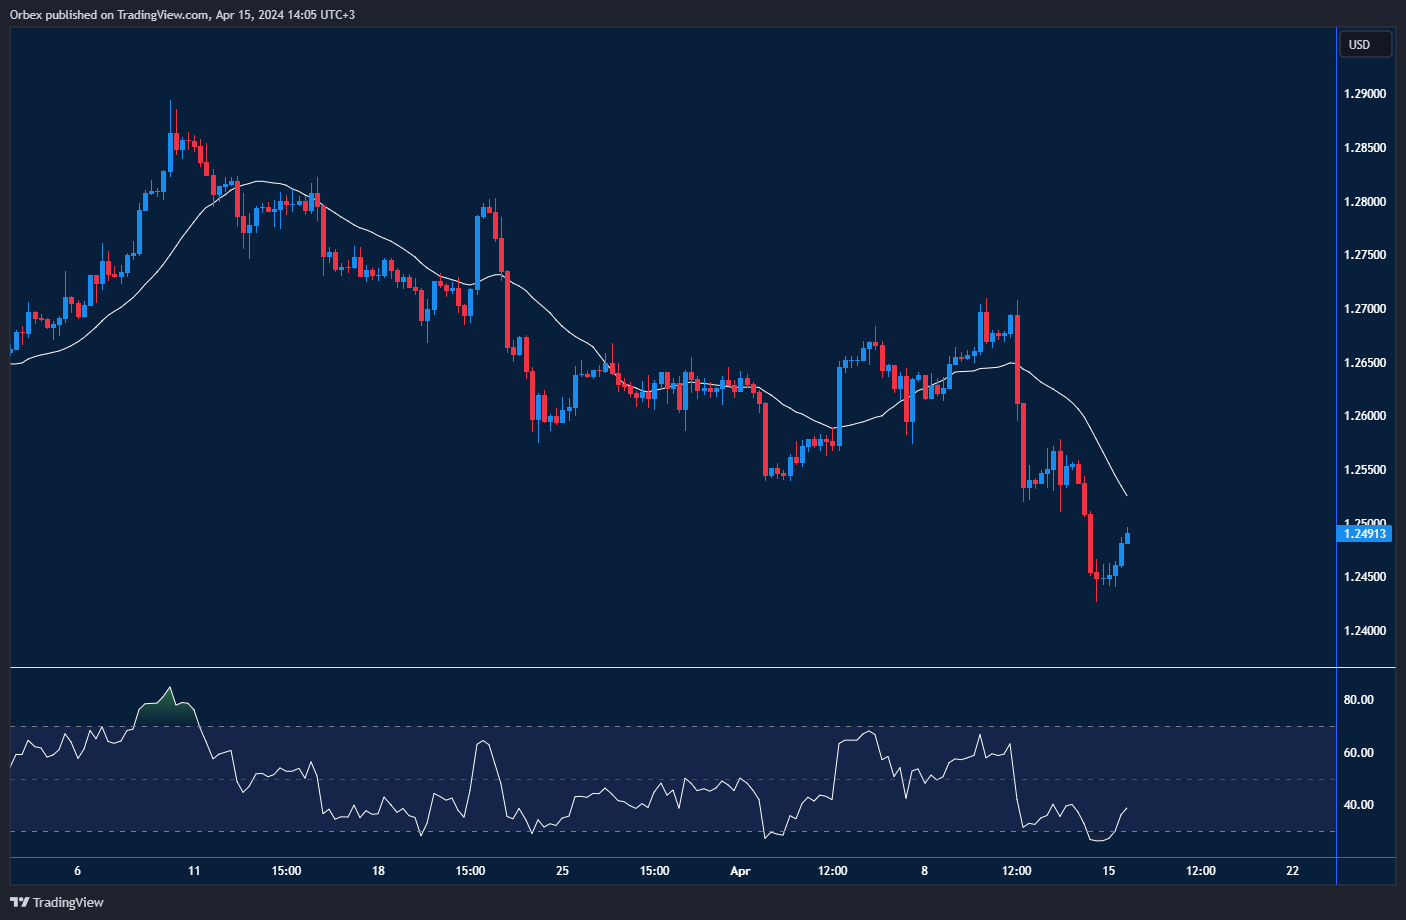

Cable found some support after an aggressive dollar opened multi-month lows. The latest sell-off has found support at 1.2430, and a bounce above the immediate resistance of 1.2450 has eased some pressure. Sentiment favours the greenback from the daily chart’s perspective; however, bulls could see the short-term consolidation as an opportunity to join the uptrend. A break above 1.2550 could convince more conservative traders to jump in. On the downside, 1.2400 would be a firm support level.
USOIL drifts lower
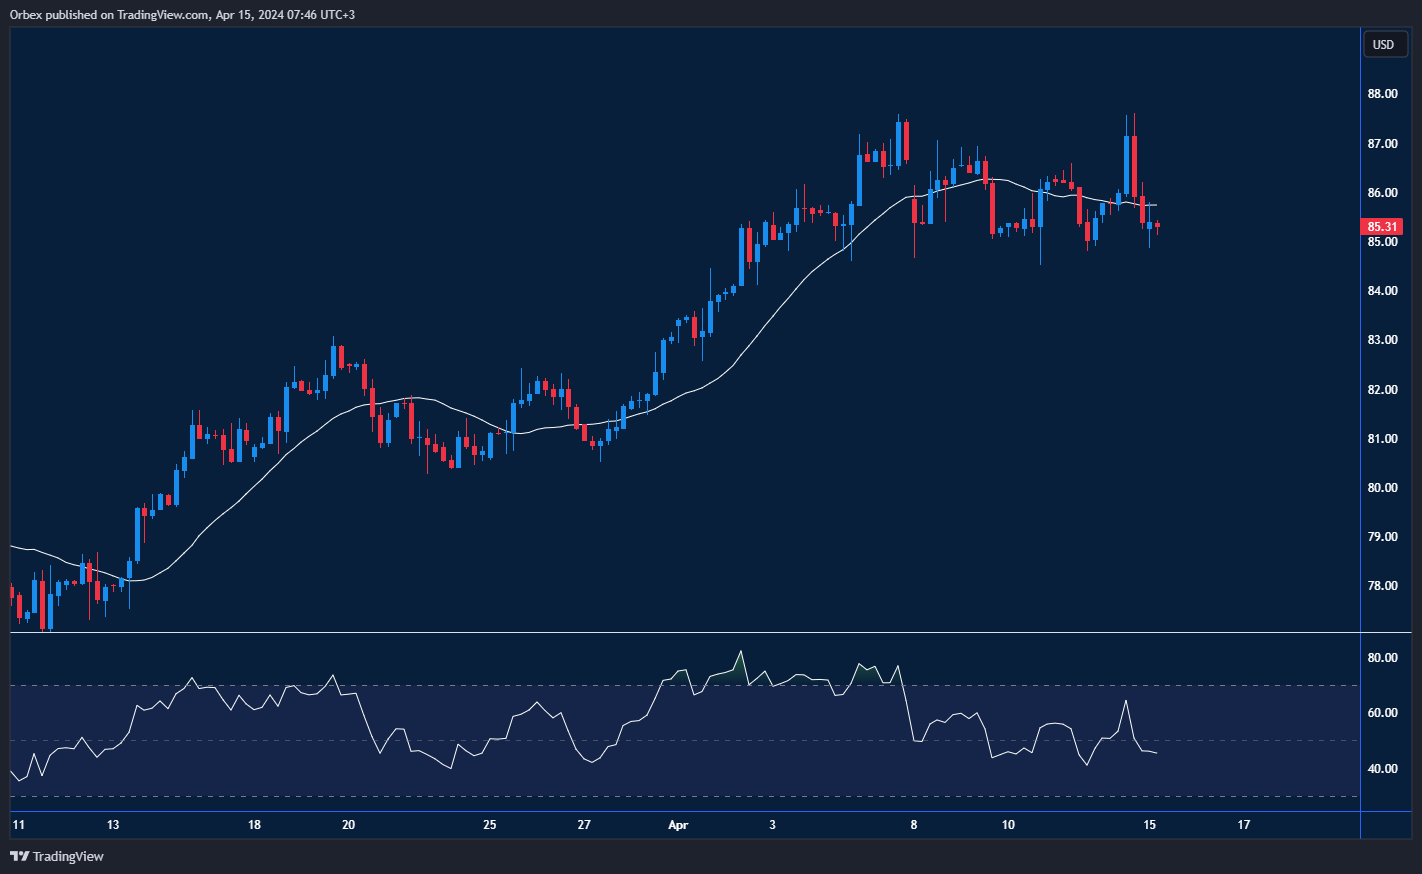
WTI also saw a price fall due to the recent fluctuating tensions in the market. With oil nearing a 6-month high, traders estimated a push to $100 before the quarter is done. Bulls struggled to hold the 87.00 level as the upward momentum died down. The price might be vulnerable to a broader sell-off after it broke below 85.00. 83.50 next to the daily SMAs’ bullish cross would be an essential support. 86.40 is the closest resistance ahead.

